


Introduction
As organizations adopt more sophisticated technologies and infrastructure to power their digital transformation, the volume and complexity of logs generated across environments continues to grow exponentially. Effective log collection, analysis and monitoring has become crucial for ensuring the security, performance and reliability of modern IT ecosystems. This blog evaluates the top 15 log analysis solutions currently available to help organizations gain actionable insights from their logs and proactively detect and respond to issues.
Methods of Evaluation
To identify the top 15 log analysis solutions for this evaluation, we considered various quantitative and qualitative factors such as features, pricing, support availability, customer reviews and ratings. Beyond typical evaluation metrics, we also looked at more nuanced factors like number of backlinks, traffic and keyword trends to understand the market position and mindshare of each vendor. Some of the key capabilities evaluated include log ingestion volume, search capabilities, visualization and reporting features, integrations, pricing flexibility, scalability and more. The list is arranged alphabetically and not ranked in any particular order based on the evaluation.
1. IBM QRadar
IBM QRadar is a SIEM solution developed by IBM for log analysis, security information and event management. QRadar provides visibility into users, applications, devices, and security events across an organization through integrated security intelligence and forensic analysis.
Pros: Some key advantages of IBM QRadar include: wide range of out-of-the-box content and applications, advanced threat detection and investigation tools, coverage of network, endpoint, cloud and identities, and excellent for compliance and audit needs.
Cons: One potential disadvantage is that QRadar requires more resources and expertise to set up and manage compared to some simpler log analysis tools.
Pricing: Pricing for IBM QRadar varies based on the edition, modules, and support selected. It has basic, professional, and premier editions starting at around $35K-60K per year with additional costs for deployment size, premium support, and additional modules.
Some key stats about IBM QRadar include: it can process over 32 billion events per day, supports over 50 integrated security technologies and applications, covers network, endpoint, cloud and identity data sources, and has over 4,000 pre-built security content to detect threats.
2. Elastic Stack (ELK)
Elastic Stack (ELK), formerly known as Elasticsearch, Logstash, and Kibana (ELK), is an open source analytics stack for all types of data. It allows users to search, analyze, and visualize data in real-time. At its core, Elastic Stack (ELK) is powered by Elasticsearch, a distributed, scalable, and lightning fast search and analytics engine designed for distributed environments.
Pros: Some key advantages of Elastic Stack (ELK) include: Open source and highly customizable. Great for log aggregation, analytics and visualization. Powerful query language to search and analyze logs. Large community support with thousands of plugins and integrations. Scales horizontally to handle petabytes of data and millions of documents.
Cons: Pricing for enterprise-level support and additional features. Requires expertise to install, configure and operate at scale. Community edition has limited upgrade path without additional costs.
Pricing: Elastic Stack (ELK) community edition is free and open source. Paid plans including Elastic Cloud on AWS, Elastic Cloud Enterprise, and Elastic Enterprise Search start at $500/month for small deployments.
Some key stats about Elastic Stack (ELK) include: Used by thousands of companies worldwide including Cisco, Sony, and Adobe. Elastic Stack can store and analyze petabytes of data. It allows real-time search across structured and unstructured data. Elasticsearch can process billions of documents across hundreds of servers in a matter of seconds.
3. Alibaba Cloud Log Service
Alibaba Cloud Log Service is a fully managed log collection and analysis service provided by Alibaba Cloud, one of the largest cloud providers in the world. It enables users to store, analyze, search and visualize logs from various sources in real-time at massive scale.
Pros: Some key advantages of Alibaba Cloud Log Service include:
– Fully managed service with no infrastructure to maintain
– Integrates seamlessly with other Alibaba Cloud products and services
– Provides real-time log ingestion, search and analytics
– Offers configurable alerts, reports and dashboards for log monitoring
Cons: The only main disadvantage is that it only works with applications hosted on Alibaba Cloud due to its tight integration.
Pricing: Alibaba Cloud Log Service pricing is based on monthly billing. The Basic Edition (up to 1GB/day ingestion) is free. For higher volumes, pay-as-you-go pricing starts at $0.1/GB for data ingestion and $0.15/GB for archive storage.
Some key stats and features of Alibaba Cloud Log Service include:
– Collects and analyzes petabytes of logs daily
– Can collect logs from various sources including applications, daemons, systems etc
– Provides real-time log search and visualization
4. Splunk
Splunk is one of the leading log analysis and monitoring platforms on the market. Founded in 2003, Splunk helps organizations collect, index, search, monitor, and analyze machine-generated data. Organizations across various industries like healthcare, retail, finance, and manufacturing use Splunk to gain insights from their logs and metrics.
Pros: Some key advantages of Splunk include:
– Extremely powerful for large-scale log analytics and correlation due to its distributed architecture
– Provides end-to-end visibility across IT infrastructure, applications, and services
– Supports customizable alerts, notifications, and dashboards for real-time monitoring
– Wide ecosystem of third-party technologies and solutions that integrate with Splunk through SDKs and APIs
Cons: One potential disadvantage of Splunk is that it can be costly for very large deployments that require premium support or cloud services due to its per-GB pricing model. However, for most organizations the capabilities it provides outweigh the costs.
Pricing: Splunk offers flexible pricing plans including on-premise licenses and cloud services. Pricing is based on the estimated peak daily data ingest rate. There are also free trials available to test out the platform.
Some key stats about Splunk include:
– Used by more than 15,000 customers worldwide including 93 of Fortune 100 companies
– Can index and search over 500 TB of data per day
– Supports over 30 different input formats out of the box including logs, metrics, and AWS CloudTrail logs
5. Loki
Loki is an open source, distributed log aggregation system from Grafana Labs. It allows you to send, process, store and query logs from many sources like applications, containers, databases and infrastructure in a serverless, cost effective way.
Pros: Some key advantages of Loki include: It is open source and free to use. Logs are stored in cost effective object storage like AWS S3. Logs can be queried using PromQL for fast access and aggregation capabilities. It is horizontally scalable for high throughput environments.
Cons: One potential disadvantage is that as an open source project, it lacks formal commercial support options compared to proprietary log aggregation tools.
Pricing: Loki is open source and free to use. There are no costs for the software itself. The main costs would be for infrastructure needed to run it like compute, storage and network.
Some key stats about Loki include: It can process and store over 100GB of logs per hour per node. Logs are stored in efficient object storage like Amazon S3 and are highly available and durable. Logs can be queried in real-time using PromQL, the query language used by Prometheus.
6. New Relic
New Relic is an observability platform that offers log analysis and monitoring capabilities. Founded in 2008, New Relic helps engineers to monitor, debug and improve their entire tech stack. With over 15 years in business, it has become one of the most popular observability tools for developers and engineers.
Pros: Some key advantages of New Relic include:
– Provides APM and logging in a single solution for full-stack observability
– Has a good UI with out of box dashboards and alerts for easy monitoring
– Offers a vast feature set beyond just logs including performance monitoring, distributed tracing and more
Cons: One potential disadvantage is that New Relic has a freemium model which can get quite expensive for enterprises with high data volumes or additional features.
Pricing: New Relic offers a freemium basic plan that is free forever for up to 2GB of monthly data ingestion. Paid plans start at $50 per month for the ‘Standard’ tier that offers unlimited ingestion.
Some key stats about New Relic include:
– Used by more than 15,000 customers including Yahoo!, Airbnb, and Docker
– Monitors over 450 billion events per day
– Available on all major cloud platforms including AWS, GCP and Microsoft Azure
7. Tenable.io
Tenable.io is a cyber exposure management platform developed by Tenable, Inc. Tenable.io provides vulnerability management, asset discovery, configuration auditing, and logging capabilities to help enterprises gain visibility and reduce risk across their attack surface. Whether assets are located in traditional IT environments or cloud infrastructures, Tenable.io gives comprehensive visibility.
Pros: Key advantages of Tenable.io include:
– Vulnerability management and monitoring capabilities to identify, track, and remediate vulnerabilities
– Automated asset discovery to find all internet-facing assets
– Configuration auditing to detect policy violations and misconfigurations
– Logging and reporting on vulnerabilities, assets, and policy compliance
Cons: One potential disadvantage is that Tenable.io is generally more expensive than some open source alternatives. However, it offers more robust features and capabilities suited for large enterprises.
Pricing: Tenable.io pricing is based on the number of assets under management. It offers either annual or monthly subscription plans. Starter plans begin at $500 per month for up to 500 assets. Mid-market and enterprise plans with enhanced features are also available, scaled to match the size and needs of different organizations.
Some key stats about Tenable.io include:
– Over 30,000 customers worldwide across all major industries
– Supports the discovery and management of over 1 billion assets
– Integrates with over 150 data sources including cloud providers, databases, firewalls, routers and more
– Available as either an on-premise or SaaS-based deployment
8. Datadog
Datadog is a leading cloud monitoring platform that provides unified observability into software applications, servers, databases, and more. In addition to metrics, traces and logs monitoring, Datadog also offers application performance monitoring capabilities.
Pros: Some key advantages of Datadog include: – Great APM and metrics monitoring in addition to logs – Easy to visualize logs and correlate with other metrics – Very scalable for high volume and fast log ingestion
Cons: One potential disadvantage is that Datadog is primarily aimed at larger enterprises and may have more features than needed for some smaller businesses.
Pricing: Datadog offers both free and paid plans. The free plan includes light use of logs, metrics, and APM. Paid plans start at $300 per month for light to moderate usage and scale up based on infrastructure size and data volume.
Some key stats about Datadog include: – Monitoring over 1 million servers – Processing over 10 trillion metrics per day – Supported by over 15,000 customers including major companies like Sony,Slack, and Spotify
9. Dynatrace
Dynatrace is an AI-powered observability platform purpose-built for modern, dynamic cloud environments. With Dynatrace, organizations gain full-stack and end-to-end observability, automatic instrumentation, AI-powered anomaly detection, and actionable insights.
Pros: Some key advantages of Dynatrace include: – Full-stack APM with distributed tracing that provides end-to-end visibility. – Unified view of logs, metrics and errors from any source for easy root cause analysis. – Advanced AI for autoscaling, anomaly detection and automatic remediation of issues before they impact customers.
Cons: A potential disadvantage is Dynatrace’s pricing which can be expensive for very large and complex environments. However, their pricing is scalable based on usage.
Pricing: Dynatrace pricing starts with a free 30-day trial. After the trial period, paid plans start at $2,500/month for 250 million HTTP requests. Pricing scales based on usage with discounts available for annual contracts. Additional modules like digital experience monitoring and software composition analysis are added at a cost.
Some key stats about Dynatrace include: – Monitors over 1 trillion dependencies daily for over 3,500 customers worldwide. – Tracks more than 120 trillion events per day across hybrid and multicloud environments. – Uses AI to analyze vast amounts of data and detect anomalies and issues in real-time.
10. Prometheus
Prometheus is an open-source systems monitoring and alerting toolkit originally built at SoundCloud. It is now a standalone open-source project overseen by the Cloud Native Computing Foundation. Prometheus offers a multi-dimensional data model with time series data identified by metric name and key/value pairs. It is effective for monitoring and observability of systems like Linux servers, Docker containers, Kubernetes clusters, etc.
Pros: Some key advantages of Prometheus include: Leader in monitoring infrastructure and application metrics. Prometheus focuses on time series data which is ideal for capturing system metrics over time. It includes a flexible query language and efficient time series database for fast retrieval and analysis of metrics. Common partner with the ELK stack for observability of systems and applications.
Cons: One potential disadvantage is that Prometheus is designed more for infrastructure and system-level metrics rather than application logs, so it works best when combined with log analytics tools like Elasticsearch, Fluentd, and Kibana.
Pricing: Prometheus is open source and free to use without restrictions. For enterprise support features, Prometheus offers commercial support subscriptions.
Some key stats about Prometheus include: It is the second most popular open source monitoring system according to the Black Duck Report. Some notable users include Bitnami, Spotify, and Elastic. It has over 7,000 stars on GitHub and a very active community.

11. Zabbix
Zabbix is an open source network monitoring solution used by millions around the world. Originally started in Latvia in 1998, Zabbix is now used by large enterprises and organizations to monitor their networks, servers, applications and cloud infrastructure. Some key facts about Zabbix are that it is open source, agent-based, and can scale to monitor millions of metrics.
Pros: Some key advantages of using Zabbix include:
– Popular open source solution with a large community and contributors
– Agent based monitoring allowing it to monitor nearly anything including custom metrics
– Can integrate with log platforms like Elasticsearch allowing it to also monitor and alert on logs
– Scales well to handle large complex infrastructures with millions of metrics
Cons: One potential disadvantage of Zabbix is that as an open source solution, it does not include official phone/email support like paid proprietary options. However, there are many consulting companies and developers who offer commercial support as well.
Pricing: Zabbix is open source and free to download and use. There are also commercial support options available directly through Zabbix LLC or via third party vendors and integrators. No licensing or per-node fees apply for the open source version.
Some key stats about Zabbix include:
– Used by over 100,000 organizations worldwide
– Can monitor over 500,000 metrics per second
– Supports monitoring over 25,000+ metrics out of the box
– Actively developed with over 500 contributors
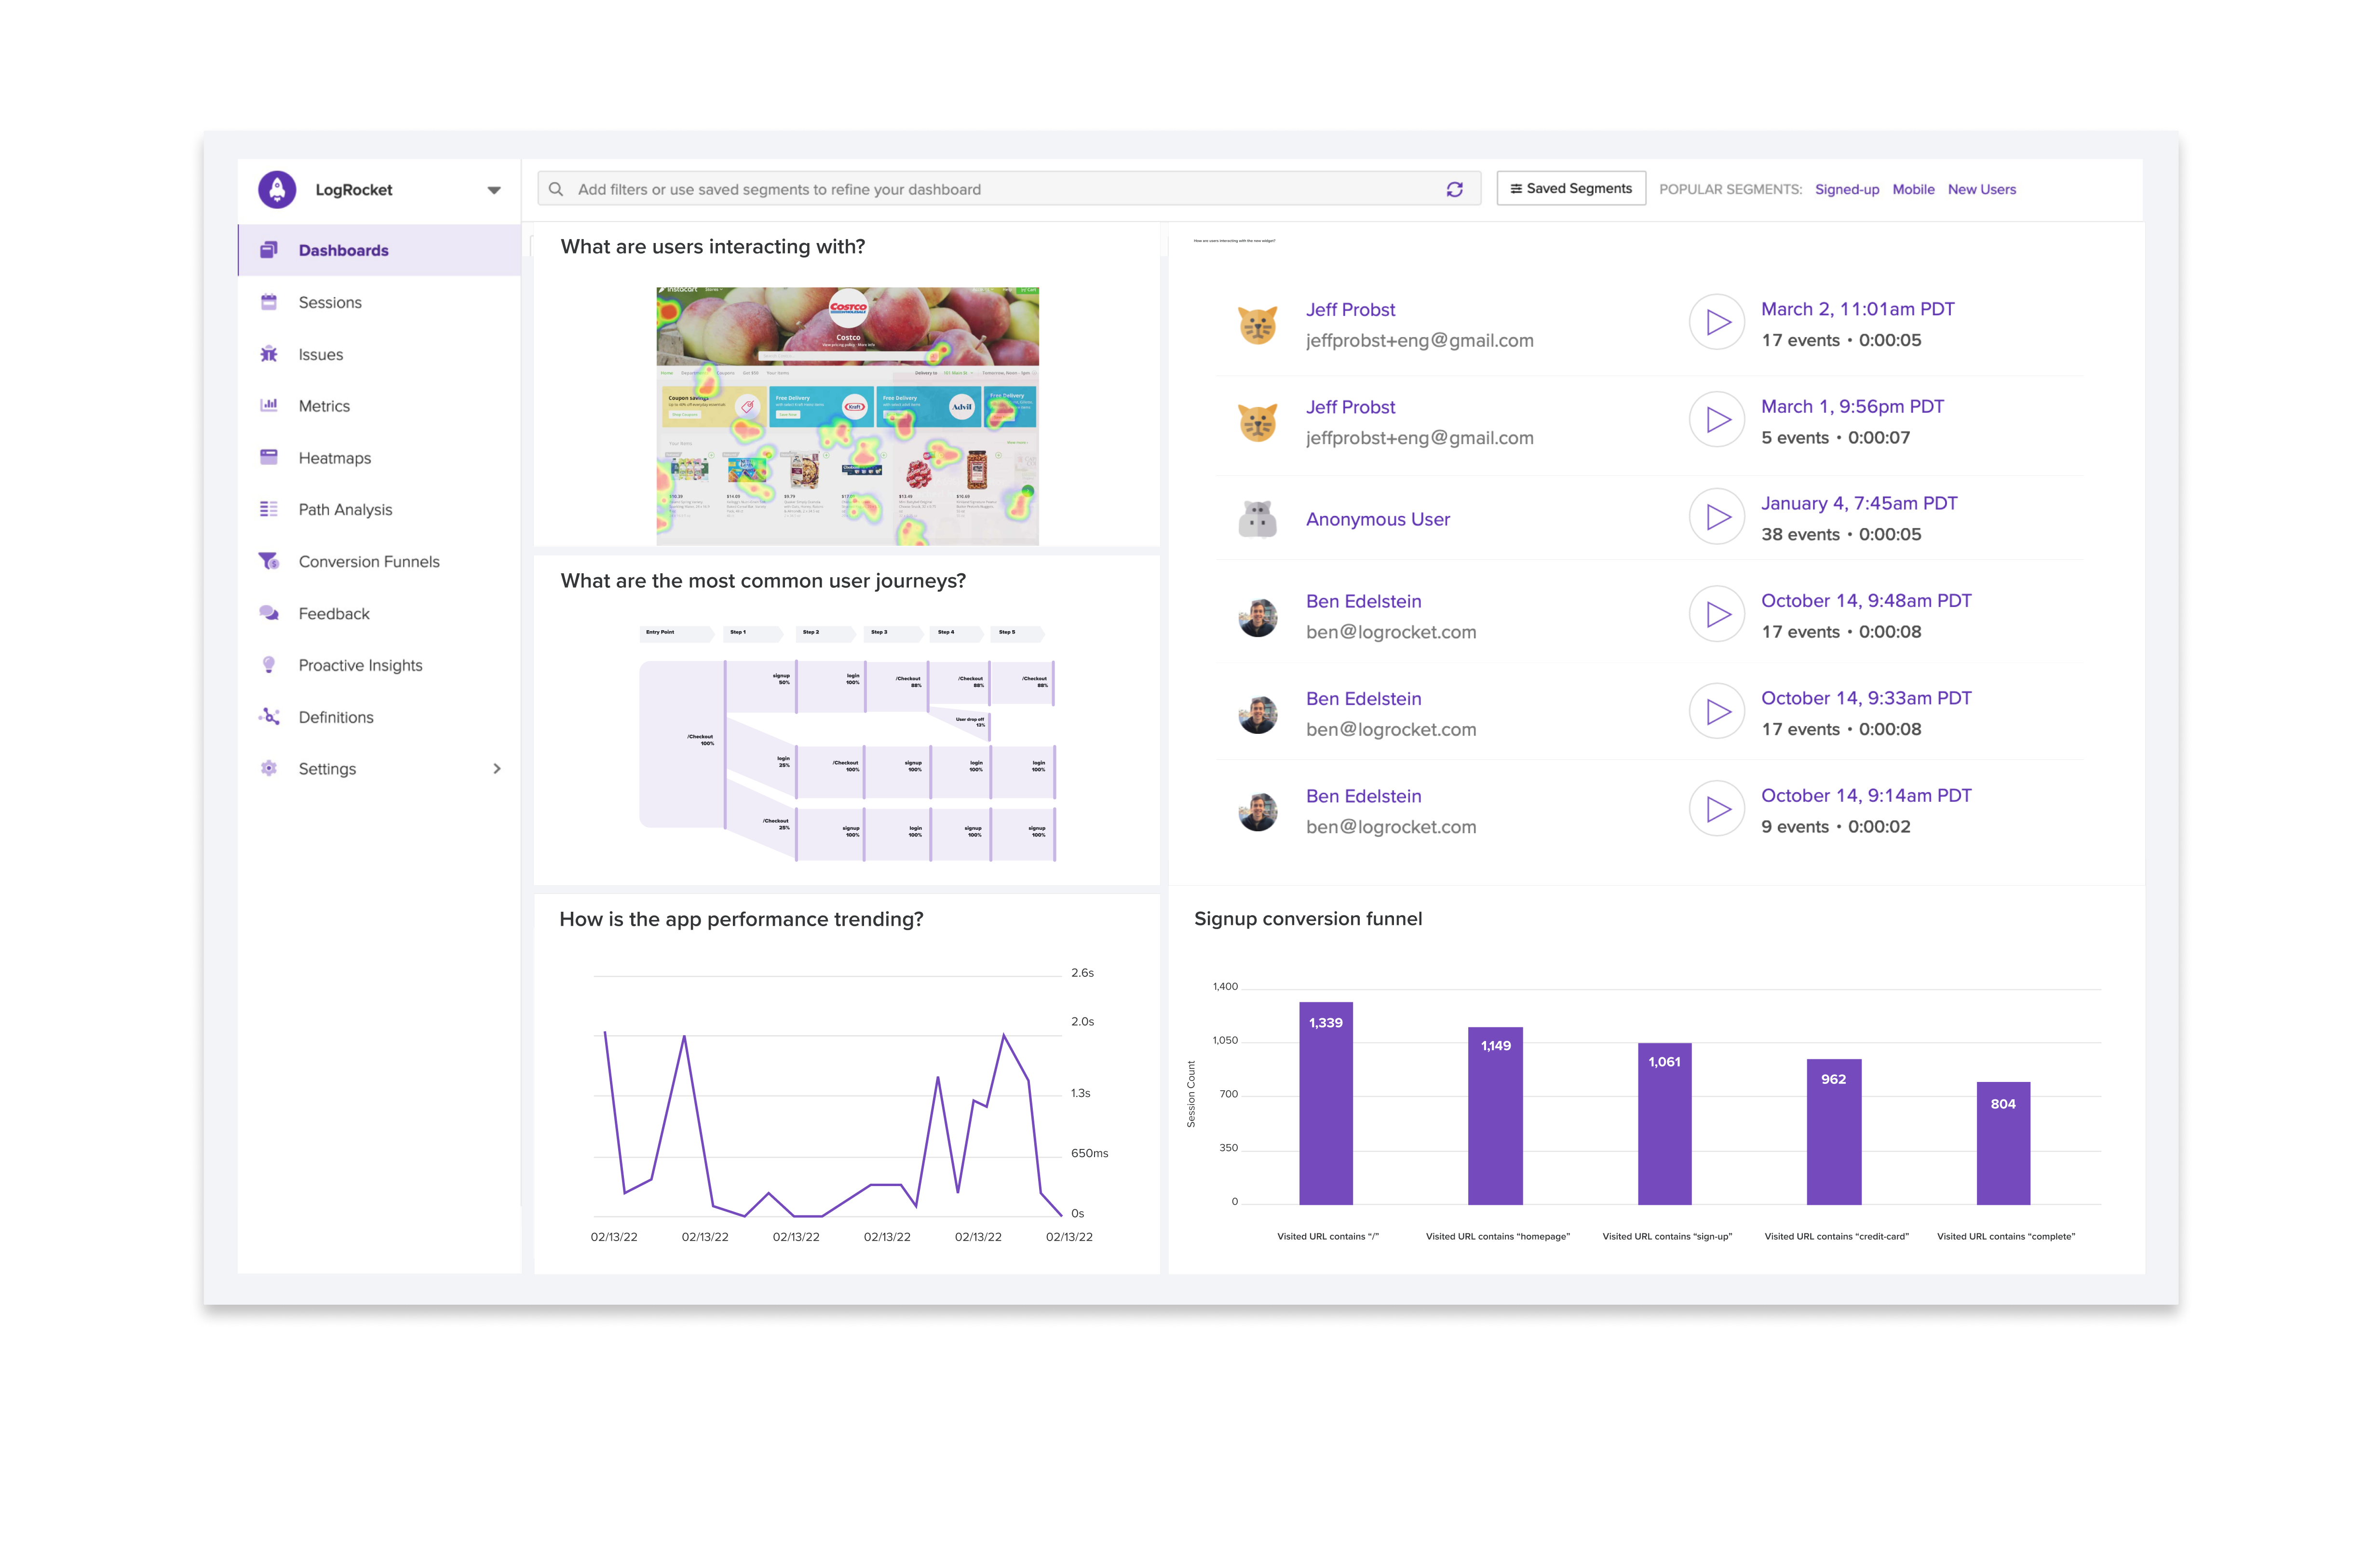
12. LogRocket
LogRocket is a frontend log management tool that allows developers to replay what users do in their apps to help troubleshoot issues. Founded in 2015, LogRocket helps development teams understand user behavior to build better software.
Pros: Some key advantages of LogRocket include:
– Specifically built for frontend log management
– Can replay logs to simulate user sessions
– Integrates with JavaScript error tracking for quick debugging
– Automatic JS error tracking with sourcemaps for easier debugging
Cons: One potential disadvantage is that the free plan only allows processing of frontend logs and errors from a single domain. For apps with many subdomains, the paid tier may be needed.
Pricing: LogRocket offers a free plan as well as paid plans starting at $149 per month for teams of 1-5 developers. Paid plans unlock additional features like logging from additional subdomains, increased storage, and support.
Some key stats about LogRocket include:
– Over 50,000 users
– Processes over 2 billion frontend actions and errors per month
– Helps companies like Anthropic, Notion, and Canva build better user experiences
13. PagerDuty
PagerDuty is an incident response and IT automation platform that helps companies manage and resolve issues faster. Founded in 2008, PagerDuty provides tools to help coordinate response teams, detect anomalies, and automate common resolution steps to keep business-critical systems running with minimal disruptions.
Pros: Key advantages of PagerDuty include:
– On-call scheduling and incident response features to ensure the right teams are notified and responding to issues
– Event correlation and anomaly detection capabilities to surface patterns in monitoring data
– Webhook integrations that allow PagerDuty to be triggered from any monitoring tool or application
Cons: One potential disadvantage is that the full capabilities of PagerDuty require purchasing one of the paid subscription tiers starting at $25 per user per month. The free plan only allows for basic on-call scheduling and alert triggering.
Pricing: PagerDuty offers three paid tiers – Starter ($25/user/month), Pro ($35/user/month), and Enterprise (custom pricing). All plans include the core on-call scheduling, incidents, and integrations functionality. Higher tiers provide additional features like advanced analytics, custom workflows, and dedicated support.
Some key stats about PagerDuty include:
– Over 12,000 customers including Box, GE, and Under Armour
– Integrations with over 450 monitoring and IT tools
– Processes over 5 billion events per month from customers

14. Sumo Logic
Sumo Logic is a cloud-based log management and analytics software. Founded in 2010 and headquartered in Redwood City, California, Sumo Logic aims to help companies gain insights from massive volumes of machine data. With its cloud-native, multi-tenant architecture, Sumo Logic can scale to handle ingestion of terabytes of logs and metrics daily.
Pros: Some key advantages of Sumo Logic include:
– Great scalability to handle ingestion of very large volumes of logs and metrics
– Powerful analytics capabilities beyond basic log monitoring with features like predictive analytics and machine learning
– Covers logs as well as metrics, security events, and other machine data sources in a single platform
Cons: One potential disadvantage of Sumo Logic is that its pricing is based on data ingestion volumes, so costs could scale significantly for very large datasets.
Pricing: Sumo Logic pricing starts with a free tier and has various paid plans based on data ingestion volumes like ‘Developer’ ($99/month for up to 500 GB/month), ‘Business’ ($349/month for up to 5 TB/month) and ‘Enterprise’ which includes custom pricing for volumes over 5 TB/month.
Some key stats about Sumo Logic include:
– Ingests trillions of logs and metrics per day for thousands of customers globally
– Analyzes over 30 petabytes of machine data daily
– Provides pre-built content packs for popular applications and tools like Kubernetes, AWS, and Microsoft Azure

15. Sysdig
Sysdig is a cloud-native visibility and security platform that provides monitoring, troubleshooting, and security for modern container and microservices architectures. Founded in 2013, Sysdig helps organizations gain visibility and control across multi and hybrid cloud environments.
Pros: Some key advantages of Sysdig include:
– Container-focused monitoring and security out of the box
– Provides vivid visualizations of microservices dependencies and traffic
– Offers centralized logging and metrics collection from containers
– Advanced troubleshooting capabilities across distributed applications
Cons: One potential disadvantage is that the product is primarily targeted towards container and microservices environments, so may not be as suitable for traditional monolithic applications.
Pricing: Sysdig offers various pricing plans including:
– Free plan for up to 3 nodes
– Bronze plan starting at $15/node per month
– Silver plan starting at $25/node per month
– Gold plan starting at $40/node per month
– Custom enterprise pricing also available
Some key stats about Sysdig include:
– Protects over 5,000 customers worldwide across various industries
– Provides visibility into over 300+ billion container events per month
– Backed by over $200 million in funding from top venture capital firms
Conclusion
The log analysis software market continues to expand and innovate at a rapid pace as enterprises recognize the importance of log monitoring for security, performance and compliance. With a wide range of options available, it is important to assess your unique monitoring and analytics requirements before shortlisting suitable solutions. Trial evaluations and proof of concepts are also recommended before deploying log aggregation and analytics platforms of this scale and complexity. We hope this overview provides a useful starting point for organizations to better understand the landscape and select the ideal log management solution to meet their monitoring needs both now and in the future.