


Introduction
Heat maps are a powerful visual analytics tool that provides important insights into how visitors interact with and engage with your website. They help uncover usability issues, areas of low engagement and opportunities for improving conversions. With the right heat map software, you can efficiently track visitor behavior, identify areas for optimization and enhance the overall experience on your website. This blog post evaluates 15 of the top and most popular heat map tools currently available to help you find the best one for your specific needs.
Methods of Evaluation
To evaluate and rank the top 15 heat map software, we considered various factors like features and functionality, pricing, ease of use, customer support, integrations, popularity based on traffic, number of backlinks, keyword rankings and customer reviews and ratings on sites like Trustpilot and G2.
1. Adobe Analytics
Adobe Analytics, formerly known as Omniture, is a software platform for web and mobile app analytics and data collection owned by Adobe. The platform provides deep insights into customer behaviors and helps organizations make data-driven decisions to optimize digital experiences. It offers a wide range of reporting and analytics capabilities from basic metrics and funnel reports to advanced segmentation and customization options.
Pros: Some key advantages of Adobe Analytics include:
– Powerful platform for customized reports, dashboards and visualization
– Advanced segmentation capabilities to analyze user behaviors in detail
– Heatmaps, scrollmaps and click overlays to see exactly where users interact on pages
– Sophisticated data modeling for flexible data collection and segmentation
– Integrates seamlessly with Adobe Experience Cloud apps for unified experiences
Cons: A potential disadvantage is that the platform has a steep learning curve and requires expert data analysts to configure properly and unlock its full potential.
Pricing: Pricing for Adobe Analytics is typically based on the number of monthly visitors or uses. It starts from $150 per month for up to 100,000 monthly visitors and goes up based on volume and additional services needed.
Some key stats about Adobe Analytics include:
– Powerful platform used by over 18,000 companies globally including 50% of Fortune 500
– Processes trillions of data points each month
– Provides actionable insights through 1500+ pre-built reports and dashboards
– Supports both web and mobile apps across iOS, Android, and other platforms

2. IBM Digital Analytics
IBM Digital Analytics, formerly known as IBM Web Analytics, is a powerful web analytics and heat mapping tool for enterprises. It provides insights into visitor behavior, goals and site performance to optimize the customer experience. With over 20 years in the market, IBM Digital Analytics is considered the gold standard for robust enterprise analytics.
Pros: Some key advantages of IBM Digital Analytics include:
– Enterprise grade analytics for large websites and applications
– Powerful heatmaps, clickmaps and scrolling path reports
– Segmentation and custom reporting for deeper insights
– Tracking across web, mobile and applications in a single platform
Cons: One potential disadvantage is the higher pricing compared to some other analytics solutions due to its enterprise capabilities.
Pricing: IBM Digital Analytics pricing is custom based on business needs, website traffic and number of users. Contact IBM sales for a customized quote.
Some key stats about IBM Digital Analytics include:
– Used by over 5,000 global brands including 25% of the Fortune 100 companies
– Processes over 1 trillion web events per month
– Provides insights into visitor behavior across desktop, mobile and applications
3. Tableau
Tableau is a business intelligence and data visualization software developed by Tableau Software. Tableau helps organizations turn complex data into actionable insights through interactive data visualizations like heat maps. Tableau’s user-friendly interface allows users to easily connect to data sources, drag and drop fields to create visualizations and share their work with others.
Pros: Some key advantages of Tableau for creating heat maps include: – User-friendly visual analytics and data visualization tool with intuitive interface to build interactive heat maps. – Wide range of built-in maps like country, region, state, city and neighborhood level heat maps. – Easy to share and publish heat maps online for internal/external collaboration or offline printing.
Cons: The only major disadvantage is that Tableau has a subscription licensing model which can get expensive at scale for large deployments.
Pricing: Tableau offers different pricing plans starting from $15 per user/month for the basic Tableau Desktop license to $70/user/month for the Tableau Creator plan. For large deployments, custom enterprise licensing agreements are available.
Some key stats about Tableau include: – Used by over 86,000 customer organizations globally including 91% of Fortune 500 companies. – Supports all major data sources like Microsoft Excel, Google Analytics, Salesforce, SQL Server etc. – Over 4 million active users as of 2021.
4. Hotjar
Hotjar is a heatmap and behavior analytics tool that helps companies understand user behavior on their websites. Founded in 2013 and based in Malta, Hotjar offers a range of features to gather qualitative and quantitative feedback from website visitors.
Pros: Some key advantages of Hotjar include:
– User-friendly and easy to set up with built-in templates
– Powerful segmentation and filtering capabilities
– Great for qualitative and quantitative data through recordings, scroll maps, click maps etc
Cons: One potential disadvantage is that the free plan only allows for up to 100 daily active users, so it may not be suitable for higher traffic websites.
Pricing: Hotjar offers three paid plans – Basic ($49/month), Pro ($99/month) and Business ($249/month). The pricing is based on the number of daily active users.
Some key stats about Hotjar include:
– Used by over 2 million websites globally
– Analyzes over 5 billion visitor sessions per month
– Provides heatmaps, scrollmaps, exit-intent popups and feedback surveys

5. Morae
Morae is a leading user experience (UX) research platform developed by TechSmith. With Morae, researchers can conduct moderated and unmoderated usability tests to gather qualitative and quantitative insights. Key features include the ability to record and analyze participant screen interactions with heatmaps and replay sessions.
Pros: Key advantages of Morae include:
– Leading UX research platform trusted by top enterprises
– Provides heatmaps from recordings to visualize where participants click, tap or move their mouse which offers valuable insights
– Highly feature-rich platform to support both moderated and unmoderated usability testing
Cons: A potential disadvantage is the learning curve to fully leverage all of Morae’s advanced capabilities. It has a complete set of features so there is a time investment required to understand how to best utilize the different components for various study types and needs.
Pricing: Morae offers different pricing tiers depending on the number of researchers and observers. Pricing starts at $475 per month for a single researcher license. Volume licensing discounts are available for enterprise customers.
Some key stats about Morae include:
– Used by over 10,000 companies globally including 90% of Fortune 100 companies
– Supports over 50 different languages and currencies
– Has over 20 years of experience in usability testing tools
6. Mapbox
Mapbox is a leader in location services and mapping APIs. Founded in 2010 and based in Washington, D.C., Mapbox provides tools and services to add location features like maps, search, and navigation into mobile and web applications. With over 150,000 customers globally, Mapbox powers maps for organizations like The New York Times, Esri, Lonely Planet, and more.
Pros: Some key advantages of Mapbox include:
– Leader in mapping APIs with excellent customization options
– Wide range of highly stylized map styles to choose from
– Integrations for many programming languages including JavaScript, Python, Java, and .NET
– Capabilities like geoencoding, geofencing, routing, and directions
Cons: One potential disadvantage is that Mapbox has a free tier but many advanced features require paid subscription plans starting at $29/month.
Pricing: Mapbox offers the following paid pricing plans for its API and tools:
– Starter – $29/month – Best for smaller teams and non-commercial projects
– Growth – $99/month – Recommended for most organizations
– Scale – Custom priced plan – For high volume enterprise customers
Some key stats about Mapbox:
– Processes over 5 trillion geospatial requests per month
– Covers over 100 countries and territories with map data
– Over 10 years in business
– 150,000+ customers including large companies like Uber, Forbes, and Snap Inc.

7. Intercom
Intercom is a customer communication platform that helps companies support and engage customers across various channels. With Intercom, companies can understand user behavior through insights and automate repetitive tasks to provide faster customer support. Some key features of Intercom include CRM focused on customer conversations, heatmaps and clickmaps to understand website visitor behavior, and insights on visitor behavior across digital channels.
Pros: Some key advantages of Intercom include:
– Combined AI assistance and human support for faster resolution of customer issues.
– Detailed insights and analytics on website and app usage through heatmaps and clickmaps.
– Omnichannel messaging across web, mobile, email and other channels from a single pane.
– Automation capabilities to handle common queries and pass complex issues to agents.
– Personalized messages and segments based on user profile and behaviors.
Cons: A potential disadvantage of Intercom could be the pricing, as it is usually on the higher side compared to some other competitors. However, it provides more advanced features and scales well for large businesses.
Pricing: Intercom offers the following pricing plans:
-Startup: Free for up to 500 monthly active users.
-Pro: $99 per agent seat per month for up to 50,000 monthly active users.
-Business: Price varies based on business needs for over 50,000 monthly active users.
Additional seats, premium features and support are available with custom enterprise plans.
Some key stats about Intercom include:
– Used by over 26,000 businesses worldwide including DigitalOcean, Github, and Amazon Alexa Fund.
– Supports over 1 billion end users globally across web, mobile, and email.
– Average implementation time is under 2 weeks to get basic setup and features working.
– Click-through rates on messages are 25-50% higher than email alone.

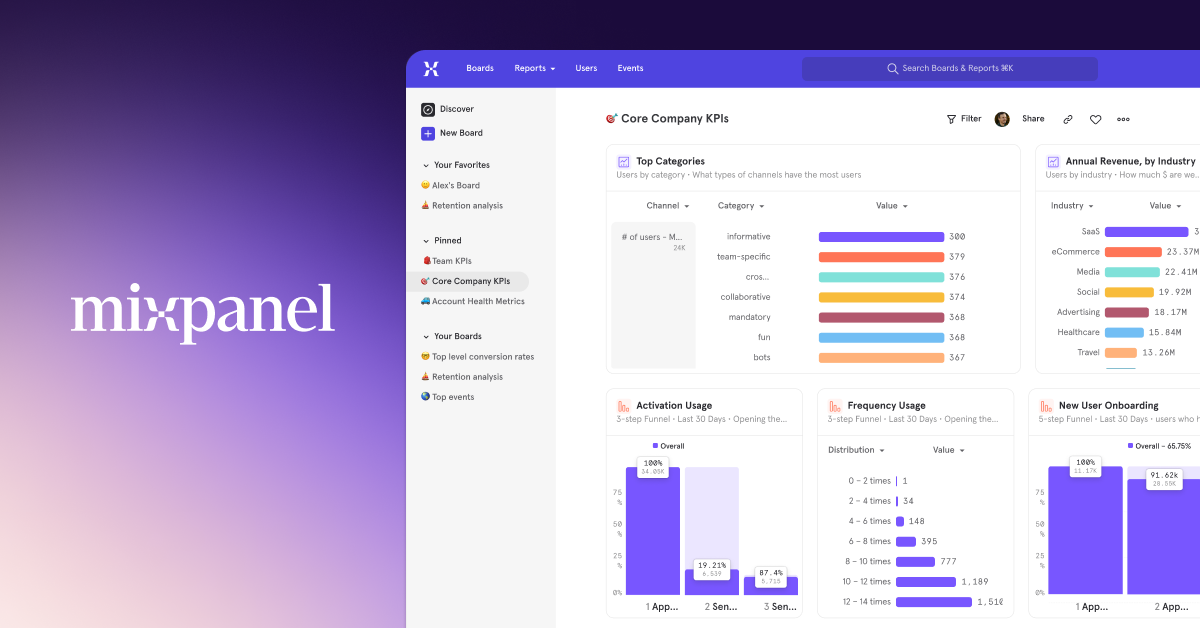
8. Mixpanel
Mixpanel is a product analytics platform that helps companies analyze user behavior and engagement across various touchpoints to improve their digital products. Founded in 2009 and headquartered in San Francisco, Mixpanel has helped over 26,000 customers use data to build better products.
Pros: Some key advantages of Mixpanel include:
– Detailed analytics and reports on user behavior
– People profiles for better segmentations
– Standout scrollmaps and clickmaps to visualize user journeys
Cons: One potential disadvantage is that the free plan only allows 10,000 events per month which may not be sufficient for many small businesses in their early growth stages.
Pricing: Mixpanel offers both freemium and paid plans. The free plan supports up to 10,000 events per month. Paid plans start at $199 per month for the Growth plan (up to 100k events/month) and go up to $999 per month for the Enterprise plan (unlimited events).
Some key stats about Mixpanel include:
– Over 26,000 customers including Microsoft, Twitter, and Expedia
– Tracks over 1 trillion events per month
– Profiles over 100 billion people worldwide
9. VWO
VWO is an A/B testing and conversion optimization platform that helps companies improve website experiences and increase profits through continuous experimentation. Founded in 2008, VWO has more than 15,000 customers including Microsoft, GE Healthcare, and Spotify. With VWO, users can run various types of tests like A/B tests, multivariate tests, and targeting experiments to find the most effective user experiences.
Pros: Some key advantages of VWO include: – A/B testing, multivariate testing and targeting capabilities allow testing of numerous on-page variables – Heatmaps, scrollmaps and recordings provide insights into user behavior – Funnel analysis helps optimize user flows and conversion rates
Cons: A potential disadvantage is that additional costs are incurred for VWO’s more advanced features, reports, and higher user limits. The free version only allows two concurrent experiments.
Pricing: VWO offers three pricing tiers: Basic at $99/month, Pro at $199/month, and Enterprise with custom quoting. The Basic plan supports 2 users and 2 concurrent experiments. The Pro plan has 5 users and unlimited experiments. Enterprise tiers provide additional features, support, and capabilities tailored for large organizations.
Some key stats about VWO include: – Runs over 1.5 million experiments per year – Analyzes over 1 trillion annual page views – Has over 15,000 paying customers globally across all industries
10. Segment
Segment is a customer data platform (CDP) that helps companies collect, clean, and activate customer data. As one of the leading CDPs on the market, Segment centralized data from multiple sources and provides powerful analytics capabilities. Some key capabilities include heatmaps, clickmaps, and tracking event analytics across channels.
Pros: Some key advantages of Segment include its powerful event analytics platform, ability to centralize customer data from multiple sources like web, mobile, APIs, and server-side APIs, and its heatmap and clickmap capabilities for understanding customer behavior.
Cons: As an event-based CDP, Segment requires some technical knowledge to configure destinations, track events, and extract value. The free tier also has limitations for data volumes and destinations.
Pricing: Segment offers both freemium and paid tiers. The freemium tier provides limited functionality for up to 100k monthly active users. Paid tiers start at $999/month for the Standard plan and scale up based on data volumes and requirements.
Segment has been ranked the #1 CDP by IDC for four consecutive years from 2019-2022. Some key stats include supporting over 50,000 integrations, processing over 500 billion events per month, and having over 1,800 employees globally.
11. Domo
Domo is an all-in-one low-code platform that allows users to build and share analytics dashboards and insights. In addition to standard charts and graphs, Domo offers robust geographic data capabilities that make it easy to generate and customize heat maps. Users can connect Domo to virtually any internal or external data source including cloud data warehouses to bring in the location data needed to power heat maps.
Pros: Key advantages of Domo’s heat map capabilities include:
– All-in-one platform for fast setup of heat maps without requiring additional mapping or GIS tools
– Intuitive drag-and-drop interfaces allow non-technical users to build and customize heat maps
– Built for collaboration – easily share and embed heat maps across your organization
– Connects to various data sources so you can apply geography to any relevant dataset
Cons: One potential disadvantage is that as a low-code platform, Domo may not offer the level of customization or advanced analytical functions available in specialized mapping and GIS software. However, for most basic to intermediate heat mapping needs, Domo provides a robust and easy to use solution out of the box.
Pricing: Domo’s pricing starts at $1500/month for the Starter tier which supports up to 3 users and includes basic analytic and heat mapping capabilities. For medium-sized businesses, the recommended Professional tier is $3000/month and supports up to 25 users. Custom enterprise pricing is also available.
Some key stats about Domo’s heat map capabilities include:
– Supports over 50 mapping and geo-encoding data types out of the box
– Ability to visualize data across multiple geographical hierarchies simultaneously
– Customizable styles, colors, and zoom levels for dense or sparse data
– Built-in geocoding of addresses to latitude/longitude coordinates

12. MouseFlow
MouseFlow is a leading web analytics tool that provides heat maps, click maps, and session recordings to understand user behavior on websites. Founded in 2013 and based in Lithuania, MouseFlow helps teams improve their digital products and optimize conversions.
Pros: Some key advantages of MouseFlow include:
– Heatmaps, clickmaps and scrolling paths provide visual insights into where users click, tap and scroll on pages
– Real user session recordings allow teams to replay user sessions to debug usability issues
– Usability testing options allow incorporating feedback into session replay analysis
Cons: A potential disadvantage is that MouseFlow’s more advanced features like A/B testing and digital surveys require an Enterprise plan which is more expensive than the Standard plan for basic heatmaps and session recordings.
Pricing: MouseFlow offers three pricing tiers:
– Free Plan: Basic heatmaps and session recordings for up to 2 sites and 10,000 monthly visitors
– Standard Plan: Starts at $99/month for heatmaps and recordings for up to 10 sites and 100,000 monthly visitors
– Enterprise Plan: Custom quotes for advanced features, priority support, and larger volumes
Some key stats about MouseFlow include:
– Over 10,000 customers worldwide including Fortune 500 companies like Adidas, Toyota, and Samsung
– Processes over 1 billion visitor sessions per month
– Integrates with over 100 analytics and marketing tools like Google Analytics and Hubspot
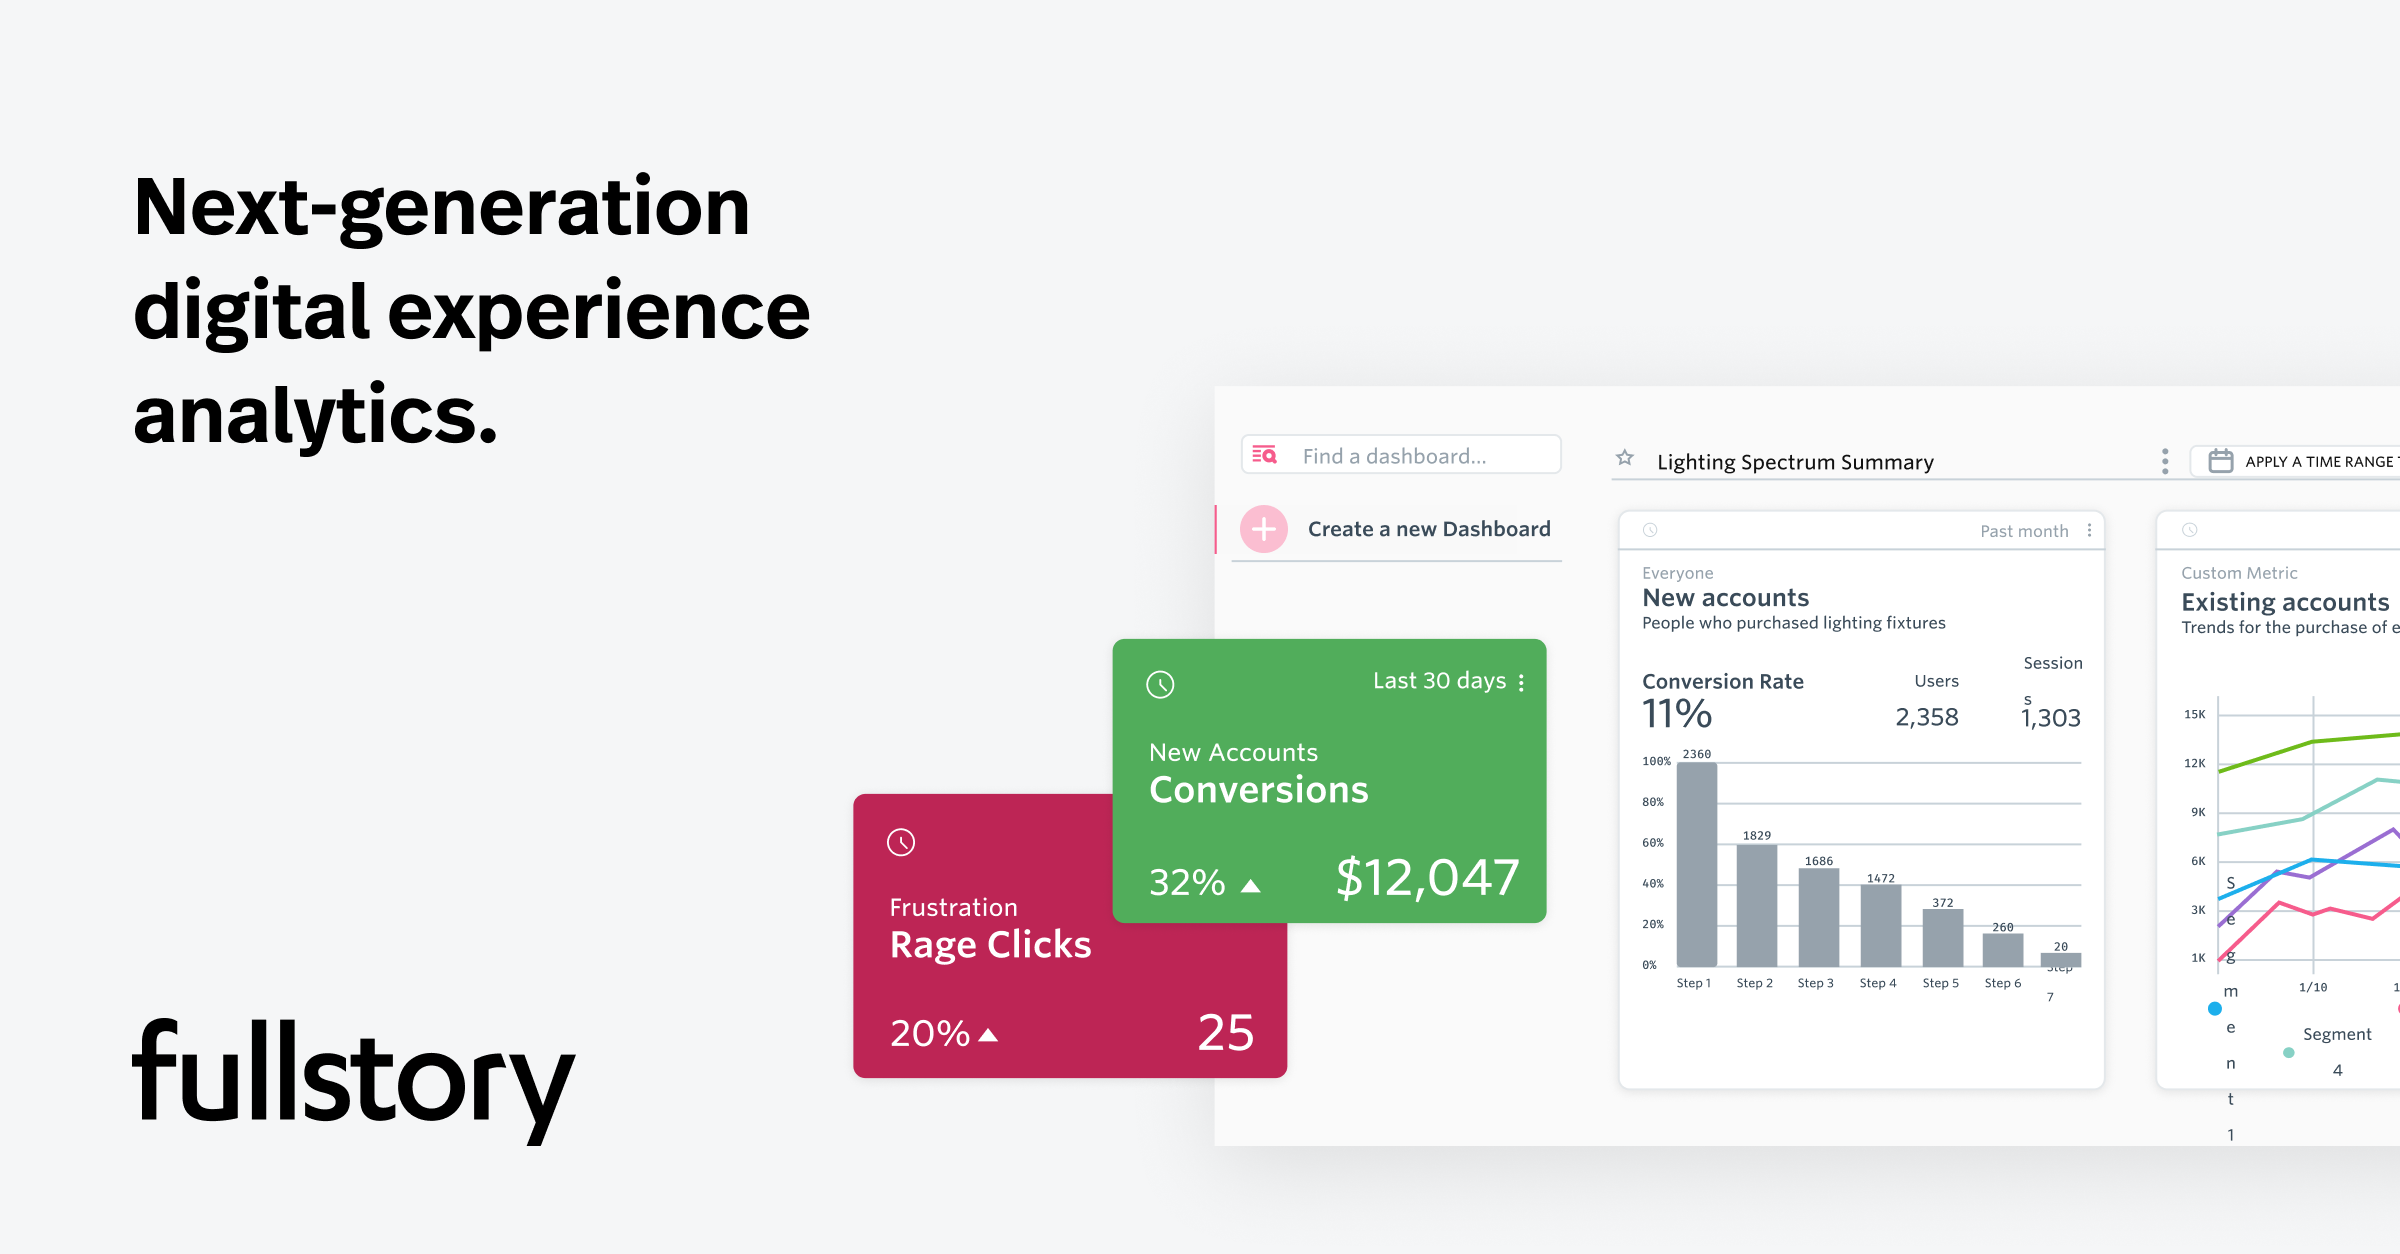
13. FullStory
FullStory is a leader in digital experience intelligence. Founded in 2012, FullStory helps organizations understand customer and user behavior across their digital properties like websites, mobile apps, and desktop applications. With offices in Atlanta and San Francisco, over 2,000 customers worldwide like Intel, Vimeo, and Twilio use FullStory to see what users are experiencing on their digital properties and drive improvements.
Pros: Some key advantages of FullStory include:
– Powerful session replays with playback controls to see exactly what users are doing
– Heatmaps, scrollmaps and clickmaps show where users are interacting on sites and apps
– Omnichannel insights across web, mobile, desktop so you can understand the full customer journey
Cons: A potential disadvantage is that FullStory requires adding JavaScript to all pages being tracked, which some may see as invasive. However, FullStory encrypts all data in transit and does not collect any personally identifiable information.
Pricing: FullStory offers tiered plans starting at $799 per month for the ‘Starter’ plan which includes support for 1 site/app and up to 10,000 monthly active users. The ‘Professional’ plan starts at $1,999 per month and includes support for 3 sites/apps and up to 100,000 monthly active users.
Some key stats about FullStory include:
– Over 2,000 customers worldwide including many Fortune 500 companies
– Session replays and event data for over 10 billion user sessions per month
– 13 million daily active users insights across websites, mobile apps, and desktop applications
14. Sisense
Sisense is an AI-powered analytics platform that allows users to build intelligent applications and embed analytics and insights into products and services. Founded in 2004 and headquartered in New York, Sisense has thousands of customers around the world spanning industries like manufacturing, retail, finance and more. Their flagship product is a business intelligence and analytics platform that enables users to harness data from various sources and uncover key insights.
Pros: Some key advantages of the Sisense heat mapping and analytics capabilities include:
• Powerful visual analytics and data discovery capabilities allow users to quickly build interactive heat maps and dashboards from various data sources.
• Easy to build and share heat maps from any data source like customer databases, sales data, online user behavior data and more.
• Built-in geographical maps and ability to overlay normalized and aggregated data onto maps for location-based insights.
• Integration with popular BI tools like Tableau, Qlik and Power BI allows embedding maps and analytics within existing workflows.
Cons: A potential disadvantage of Sisense could be the learning curve required to master some of the more advanced visualizations, widgets and modeling techniques on the platform. While it aims to be intuitive and easy to use, there is still a learning process involved to unlock its full potential.
Pricing: Sisense offers flexible pricing plans starting from free versions for developers and small teams to enterprise plans based on usage. Pricing generally ranges from $75 per user per month for the Starter plan to hundreds of dollars per user for the Enterprise plan which removes data and users limits.
Some key stats about Sisense include:
• Supports over 50 data sources including MySQL, SQL Server, PostgreSQL, Vertica, MongoDB, AWS Redshift and others.
• Processes petabytes of data daily for global enterprises.
• Over 1700 employees worldwide.
• Used by 80% of Fortune 100 companies.
• Deployed on-premise, in the cloud or in hybrid environments.
• Supports 14 languages and right-to-left display.

15. Clicktale
Clicktale, formerly known as Clicktale, is a digital experience analytics SaaS platform that helps companies understand customer behavior and improve their digital experiences. Founded in 2006, Clicktale provides heat map software, session replay, and funnel analysis capabilities to help organizations learn from their site and app visitors.
Pros: Some of the main advantages of Clicktale include:
– Real user session replays with click and scroll paths
– Funnel analysis across entire sites
– Cross device capabilities for mobile and desktop
Cons: One potential disadvantage is the pricing, as Clicktale is a more premium option compared to some other heat map tools.
Pricing: Pricing for Clicktale starts at $5,000 per month for the Standard package.
Some key stats about Clicktale include:
– Used by over 2,500 brands worldwide including Starbucks, Adidas, and Ticketmaster
– Collects data from over 1 billion visitor sessions per month
– Recorded session replays and interactions from over 500 million unique devices

Conclusion
Whether you need basic heat mapping capabilities or advanced session replay and funnel analytics, there is an excellent option for every budget and business size. We hope this evaluation of the top 15 heat map software helps you shortlist and choose the right solution to gain valuable insights into how visitors engage with your website. Regular analysis and optimization based on heat map data can help boost conversions and deliver a better overall experience to your customers.