


Introduction
Creating and maintaining organizational charts is crucial for effective team management and communication. However, outdated tools like Microsoft Visio make the process tedious. This is where organizational chart software comes in handy. They provide intuitive interfaces and powerful features to streamline the entire process. In this blog, we evaluate the top 15 organizational chart software based on key factors to help you find the right solution.
Methods of Evaluation
The organizational chart software are evaluated based on core functionality, features, pricing, ease of use, collaboration capabilities, integrations, reviews and ratings. Additional parameters like number of backlinks, average monthly traffic and keyword search volume trends are also considered to judge the popularity and demand for each software. This helps rank them comprehensively based on traditional evaluation methods as well as digital metrics.
1. OrgChartJS
OrgChartJS is an open source JavaScript library for rendering interactive organization charts. It is maintained on GitHub and can be used to build customizable org charts directly in the browser without any additional server-side software.
Pros: Some key advantages of OrgChartJS include:
– Open source and free to use for any purpose
– Highly configurable through simple JavaScript APIs
– Lightweight and fast with minimal performance overhead
– Interactive org charts can be drilled down, collapsible and with custom node behavior
– Themes and styles are customizable through CSS
Cons: One potential disadvantage is that as an open source library, it does not include commercial support directly from the developers. Advanced customizations may require deeper knowledge of JavaScript and HTML/CSS.
Pricing: OrgChartJS is an open source library available on GitHub under the MIT license. It can be downloaded and used for free without any licensing or support fees.
Some key stats about OrgChartJS include:
– Actively maintained open source project with over 60,000 stars on GitHub
– Lightweight at only 17KB minified and gzipped
– Highly customizable through JavaScript/CSS for styling and layout
– Rendered using SVG for crisp visuals and interactivity

2. mindMeister
MindMeister is an online mind mapping and brainstorming tool that allows users to create and share structured diagrams and charts known as mind maps. Founded in 2004 and headquartered in Vienna, Austria, MindMeister offers both free and paid subscription plans for individuals and teams.
Pros: Some key advantages of MindMeister include:
– Feature-rich mind mapping and charting tool
– Organizational templates available for common use cases like project management or brainstorming
– Robust collaboration features that allow real-time co-editing and commenting
– Integrations that allow saving mind maps directly to productivity suites
Cons: A potential disadvantage is that the free version only allows one active mind map at a time and has limited storage compared to the paid plans.
Pricing: MindMeister offers three paid subscription plans starting from $5.83/month for individuals up to $15/month for teams. It also has a free forever plan which is restricted to one active mind map and limited storage.
Some key stats about MindMeister include:
– Used by over 30 million users worldwide
– Available in 11 languages
– Over 100 ready-made organizational templates available
– Integrations with tools like Google Workspace, Microsoft Teams and Dropbox

3. Visme
Visme is a visual communication platform that allows users to create various types of org charts, along with presentations, infographics, videos and other content. Founded in 2013, Visme has its headquarters in San Francisco and has over 5 million users worldwide.
Pros: Key advantages of using Visme for org charts include:
– Visual communication platform – Create and share org charts, presentations and other visual content all in one place.
– Templates for different chart types – Choose from predefined templates for the chart type you need.
– Collaboration features – Allow internal teams and external stakeholders to view and comment on charts simultaneously.
– Integrations with Dropbox, Google Drive etc. – Easy access to files from supported cloud drives for sharing and storage.
Cons: One potential disadvantage is that the free plan only allows for limited file storage and watermarked exports. The paid plans are required for premium features and larger file sizes.
Pricing: Visme offers the following pricing plans:
– Free Plan: Allows basic usage with watermarks and 2GB storage.
– Premium Plan: $12/month billed annually for 10GB storage and no watermarks.
– Business Plan: $24/month billed annually for unlimited users, storage and advanced features.
Some key stats about Visme include:
– Templates for 17 different chart types including org charts, flow charts, mind maps and more.
– Real-time collaboration features allow multiple users to work on projects simultaneously.
– Integrates with cloud services like Dropbox, Google Drive, OneDrive and Box for easy file sharing and storage.

4. Lucidchart
Lucidchart is an intuitive org chart software that allows users to easily create and manage organization charts. With Lucidchart, you can visually represent your company’s structure and relationships with flowcharts, org charts, wireframes, and more. Lucidchart is a cloud-based tool that enables real-time collaboration across desktop and mobile.
Pros: Key advantages of Lucidchart include:
– Intuitive diagramming tool makes it easy for anyone to quickly build org charts
– Built-in templates and shapes for common org chart elements like departments, positions, etc.
– Enables collaboration in real-time so charts can be edited together across locations
– Integrations allow data to be easily pulled from other work platforms for updated org charts
Cons: One potential disadvantage is that the free plan only allows for 5GB of storage which may not be sufficient for larger companies with more complex org structures.
Pricing: Lucidchart offers 3 paid plans starting from $9.99/user per month for the Team plan.
Some key stats about Lucidchart include:
– Used by over 30 million users worldwide
– Integrates with Google Workspace, Microsoft 365 and other top cloud productivity tools
– Available on desktop and mobile for both Android and iOS
– Store charts in the cloud for access from anywhere

5. OmniGraffle
OmniGraffle is org chart diagramming software developed by The Omni Group. It is a Mac-based application that allows users to create a variety of diagrams and charts including organization charts, flowcharts, schematics, and more. With OmniGraffle’s intuitive interface and tools, users can easily construct both simple and complex diagrams.
Pros: Some key advantages of OmniGraffle include:
– Intuitive Mac interface and tools optimized for diagramming
– Excellent templates for common chart types like org charts
– Superior formatting and styling controls
– Integration with other OmniGroup apps like OmniFocus and OmniOutliner
– Regular feature and functionality updates
Cons: The main disadvantage is that OmniGraffle is only available on Mac systems and does not have a Windows version.
Pricing: OmniGraffle pricing starts at $99.99 for a standard standalone license. Volume discounts are available for business and enterprise users. An OmniGraffle + OmniOutliner bundle can also be purchased for $149.99.
Some key stats about OmniGraffle include:
– Used by over 1 million professionals worldwide
– Available on Mac only
– Supports a wide variety of chart types beyond just org charts including flowcharts and network diagrams
– Has been in continuous development since 2001
6. Podio
Podio is an all-in-one work management platform that allows teams to customize workflows, track projects, and streamline communication. In addition to its robust task management and file sharing tools, Podio offers powerful org chart capabilities for visualizing team structures and roles. With pre-built org chart templates and tight integration with popular productivity tools like Google Workspace, Podio is a versatile platform for managing teams of all sizes.
Pros: Some key advantages of Podio for org chart management include: all-in-one platform for centralizing workflows, projects and communication; tight Google Workspace integration for profile linking and communication tools; robust access controls and permissions for protecting sensitive team information; templates to accelerate onboarding of standard structures.
Cons: One potential disadvantage is that Podio’s org chart and profile features are part of a more full-featured work management platform, so it may be overkill for teams only requiring basic org chart visualization.
Pricing: Podio offers three pricing plans for its work management platform – Starter, Pro, and Business. Pricing ranges from free for up to 3 users to $15-25 per user per month for the Pro and Business plans. All plans include the full capabilities of Podio including org chart and team profiles.
Some key stats about Podio’s org chart features include: ability to visualize hierarchies of up to 5,000 people; templates for common org structures like functional, divisional, and matrix models; ability to link org chart nodes to customizable profiles for each team member.

7. Creately
Creately is a visual collaboration and diagramming platform that helps teams communicate visually. Their powerful diagramming tools make Creately one of the best org chart software options for teams looking to create and manage organizational structures. Founded in 2008, Creately now has over 10 million users across various industries.
Pros: Some key advantages of using Creately for org charts include:
– Flexible tool for creating org charts and workflow diagrams visually
– Real-time collaboration using comments, mentions, and embedded videos
– Integrations allow linking data from other tools into diagrams
– Sharing and exporting options for collaboration across teams
Cons: One potential disadvantage is that the free plan only allows for basic features. For advanced features like version control, approvals and integrations, an upgraded paid plan is required.
Pricing: Creately offers 3 paid plans – Professional ($9/user/month), Business ($15/user/month) and Enterprise (custom pricing). All plans include features like unlimited storage, version control, advanced security and priority support. The Professional plan supports up to 3 users while Business supports up to 15 users.
Some key stats about Creately include:
– Used by over 10 million users worldwide
– Integrations with over 50+ applications including Notion, Airtable, Jira, etc.
– Over 1000 customers including Cisco, VMware, Microsoft, and Twitter
8. SmartDraw
SmartDraw is a diagramming and visualization software that allows users to create a variety of diagrams including flowcharts, floor plans, network diagrams, and organizational charts. The software has been on the market since 1995 and has over 20 million users worldwide. Some key industries that utilize SmartDraw include business, education, computer science, engineering, and more.
Pros: Some of the key advantages of SmartDraw include:
– Intuitive diagramming tool that is easy to use for both technical and non-technical users
– Built-in organizational chart templates that allow rapid creation of org charts
– Collaboration features that allow for real-time diagramming with others
– Integrations with Microsoft Office and Google Workspace for easy sharing and collaboration
Cons: One potential disadvantage is that the free version only allows saving of diagrams as images rather than editable files. For more advanced features like file sharing, exporting to PowerPoint, and unlimited cloud storage, an annual subscription is required.
Pricing: SmartDraw offers both free and paid plans. The free plan allows basic diagrams to be created but saves them as images only. The Pro plan starts at $299 billed annually for an individual license. Business and Enterprise plans are also available for larger organizations.
Some key stats about SmartDraw include:
– Over 20 million users globally
– Available in 11 different languages
– Integrates with Google Workspace and Microsoft Office
– Has over 150 built-in templates for common diagrams
9. Coggle
Coggle is a collaborative mind mapping tool that allows users to create and share visual representations of ideas, concepts and information. Founded in 2011 and based in London, Coggle makes it easy for individuals and teams to brainstorm, organize projects and communicate complex information visually.
Pros: Some of the key advantages of Coggle include:
– Real-time collaboration – Multiple users can work on a mind map simultaneously from different locations.
– Wide range of templates – Pre-made templates covering various topics help get started quickly.
– Export options – Mind maps can be exported to image, PDF and other formats for sharing.
– Intuitive interface – Simple and intuitive drag-and-drop interface makes mind mapping easy.
Cons: One potential disadvantage is that the free plan only allows for up to 3 mind maps. For teams or those needing more maps, an upgrade is required.
Pricing: Coggle offers the following pricing plans:
– Free – Allows up to 3 mind maps
– Premium – $6/user/month – Unlimited mind maps, file storage, exports and priority support.
– Business – Contact for pricing – Includes SSO, admin controls and more.
Some key stats about Coggle include:
– Used by over 5 million people worldwide
– Available on the web and as mobile apps for iOS and Android
– Integrates with Google Drive, Dropbox and OneDrive for cloud storage
– Offers over 30 mind map templates across different subject areas
10. Edraw Max
Edraw Max is an all-in-one diagramming solution developed by Edrawsoft. It allows users to create a wide variety of diagrams including flow charts, mind maps, organization charts, network diagrams, floor plans, and more. With its pre-made templates and intuitive interface, Edraw Max is ideal for both technical and non-technical users.
Pros: Some key advantages of Edraw Max include:
– Being an all-in-one solution for different diagram types
– Including pre-made templates to shortcut the diagramming process
– Allowing for collaboration via integrated comments and reviews
– Having an intuitive interface making it easy for non-technical users
Cons: One potential disadvantage is that the free version has some limited features compared to the premium paid versions.
Pricing: Edraw Max has the following pricing plans:
– Free version for personal use
– Commercial license starting from $99 for 1 user
– Educational license for $49
– Site license available for large businesses and organizations
Some key stats about Edraw Max include:
– Used by over 10 million users worldwide
– Available in over 20 languages
– Offers over 500 templates across different diagram types
– Integrates with Google Drive, Dropbox, OneDrive for cloud collaboration
11. Cacoo
Cacoo is a web-based diagramming and collaboration tool developed by Nulab. It allows users to create a variety of diagrams like org charts, flowcharts, wireframes and more online without having to download any software. Over 390,000 users across various industries like education, business and engineering use Cacoo for visual communication and collaboration.
Pros: Some key advantages of Cacoo include:
– Web-based tool allowing cross-platform use without downloads
– Real-time collaboration on diagrams with built-in chat
– Wide range of diagram types that can be created including org charts, flowcharts, wireframes etc.
– Integration with other tools like Google Workspace and Dropbox
Cons: One potential disadvantage of Cacoo could be the limited storage capacity in free plans compared to paid enterprise plans.
Pricing: Cacoo offers the following pricing plans:
– Free plan – Has basic features but limited storage of 5MB
– Pro plan – Starts at $5/month per user for 50MB storage
– Business plan – Starts at $15/month per user for 200MB storage
– Enterprise pricing available for teams of more than 10 users
Some key stats about Cacoo include:
– Used by over 390,000 users worldwide
– Integrations available with Google Workspace and Dropbox
– Real-time collaboration where multiple people can work on diagrams simultaneously
– Wide range of templates available including org chart templates

12. Nulab
Nulab is an online project management and collaboration tool used by thousands of organizations worldwide. The company was founded in 2008 in Tokyo, Japan and offers a feature-rich platform to help teams work better together. Some key features of Nulab include real-time collaboration, task and issue tracking, files and documents sharing, as well as built-in organizational chart capabilities.
Pros: Some key advantages of Nulab include:
– Feature-rich collaboration platform for managing projects, communicating in channels, and working on files and tasks together in real-time.
– Built-in organizational chart capabilities allow charts to be automatically generated and maintained from team and project data.
– Tight integration with popular productivity and development tools like Google Workspace, Dropbox, Github, Slack, and Jira.
– Robust permission and access controls to securely manage team access and visibility across projects and files.
Cons: One potential disadvantage is that Nulab lacks some advanced project management features found in dedicated project management solutions like detailed gantt charts, resource management, and billing/expense tracking. However, for most collaborative work it provides a very robust set of tools at an affordable price point.
Pricing: Nulab offers flexible pricing plans starting from a free Basic plan for up to 5 users. The Standard plan costs $6/user/month billed annually which provides access to all core collaboration features. Enterprise plans are also available for larger teams and organizations.
Some key stats and advantages of Nulab include:
– Used by over 5,000 companies globally including Toyota, Rakuten, and NTT Communications.
– Full featured free plan available for up to 5 users.
– Organizational charts can be automatically generated and maintained from team data.
– Integrates with over 150 apps including Google Workspace, Dropbox, Github, and more.
13. Moqups
Moqups is an online wireframing, mockup and UI prototyping tool that helps designers and teams easily create and collaborate on digital designs. It provides a simple yet powerful interface that allows users to create site maps, user flows, diagrams and more using an extensive library of pre-built elements and shapes.
Pros: Some key advantages of Moqups include:
– Free plan tier perfect for individual and small team use
– Intuitive drag-and-drop interface for fast designs
– Real-time collaboration lets multiple users work together simultaneously
– Version history and comment features builtin for project communication
– Export designs to JPEG, PNG or PDF formats for sharing
Cons: One potential disadvantage is that compared to some dedicated wireframing tools, Moqups has fewer specific UI elements and widgets. However, it makes up for this with its simplicity, cross-device compatibility and collaborative features.
Pricing: Moqups offers three pricing tiers:
– Free forever tier for unlimited projects under 3 users
– Premium from $9/month for unlimited users and projects
– Business tier from $29/month for additional admin features and support
Some key stats about Moqups include:
– Used by over 500,000 designers globally
– Available for teams of all sizes from solo freelancers to enterprises
– Integrations with top project management tools like Asana, Trello, Jira and Dropbox
– 15+ template designs for quick starts across common project types

14. Office Timeline
Office Timeline is an online timeline and org chart maker that helps teams effectively communicate organizational structures and project timelines. Their easy-to-use software allows teams to quickly turn complex data into engaging visual timelines and org charts without the learning curve of traditional design tools.
Pros: Some key advantages of Office Timeline include: beautiful pre-designed templates to get started quickly, real-time collaboration allows multiple team members to work simultaneously, integrations with Google Workspace and Office 365 for easy sharing and access to existing company data, intuitive drag-and-drop builder makes it simple for anyone to create professional quality charts.
Cons: A potential disadvantage is that the free version only allows for one user and has reduced storage and export options compared to the paid tiers. For larger organizations with many users, the pricing may be prohibitive compared to traditional design software.
Pricing: Office Timeline offers both free and paid plans. The free personal plan allows for one user, one chart up to 5MB in size. Paid plans range from $8-16/user/month and unlock additional storage, users, exports, and integrations.
Some key stats about Office Timeline include:used by over 10,000 companies worldwide, secure and compliant with GDPR and SOC 2 Type II standards, supports over 20 diagram types including org charts, Gantt charts, workflow diagrams and more.

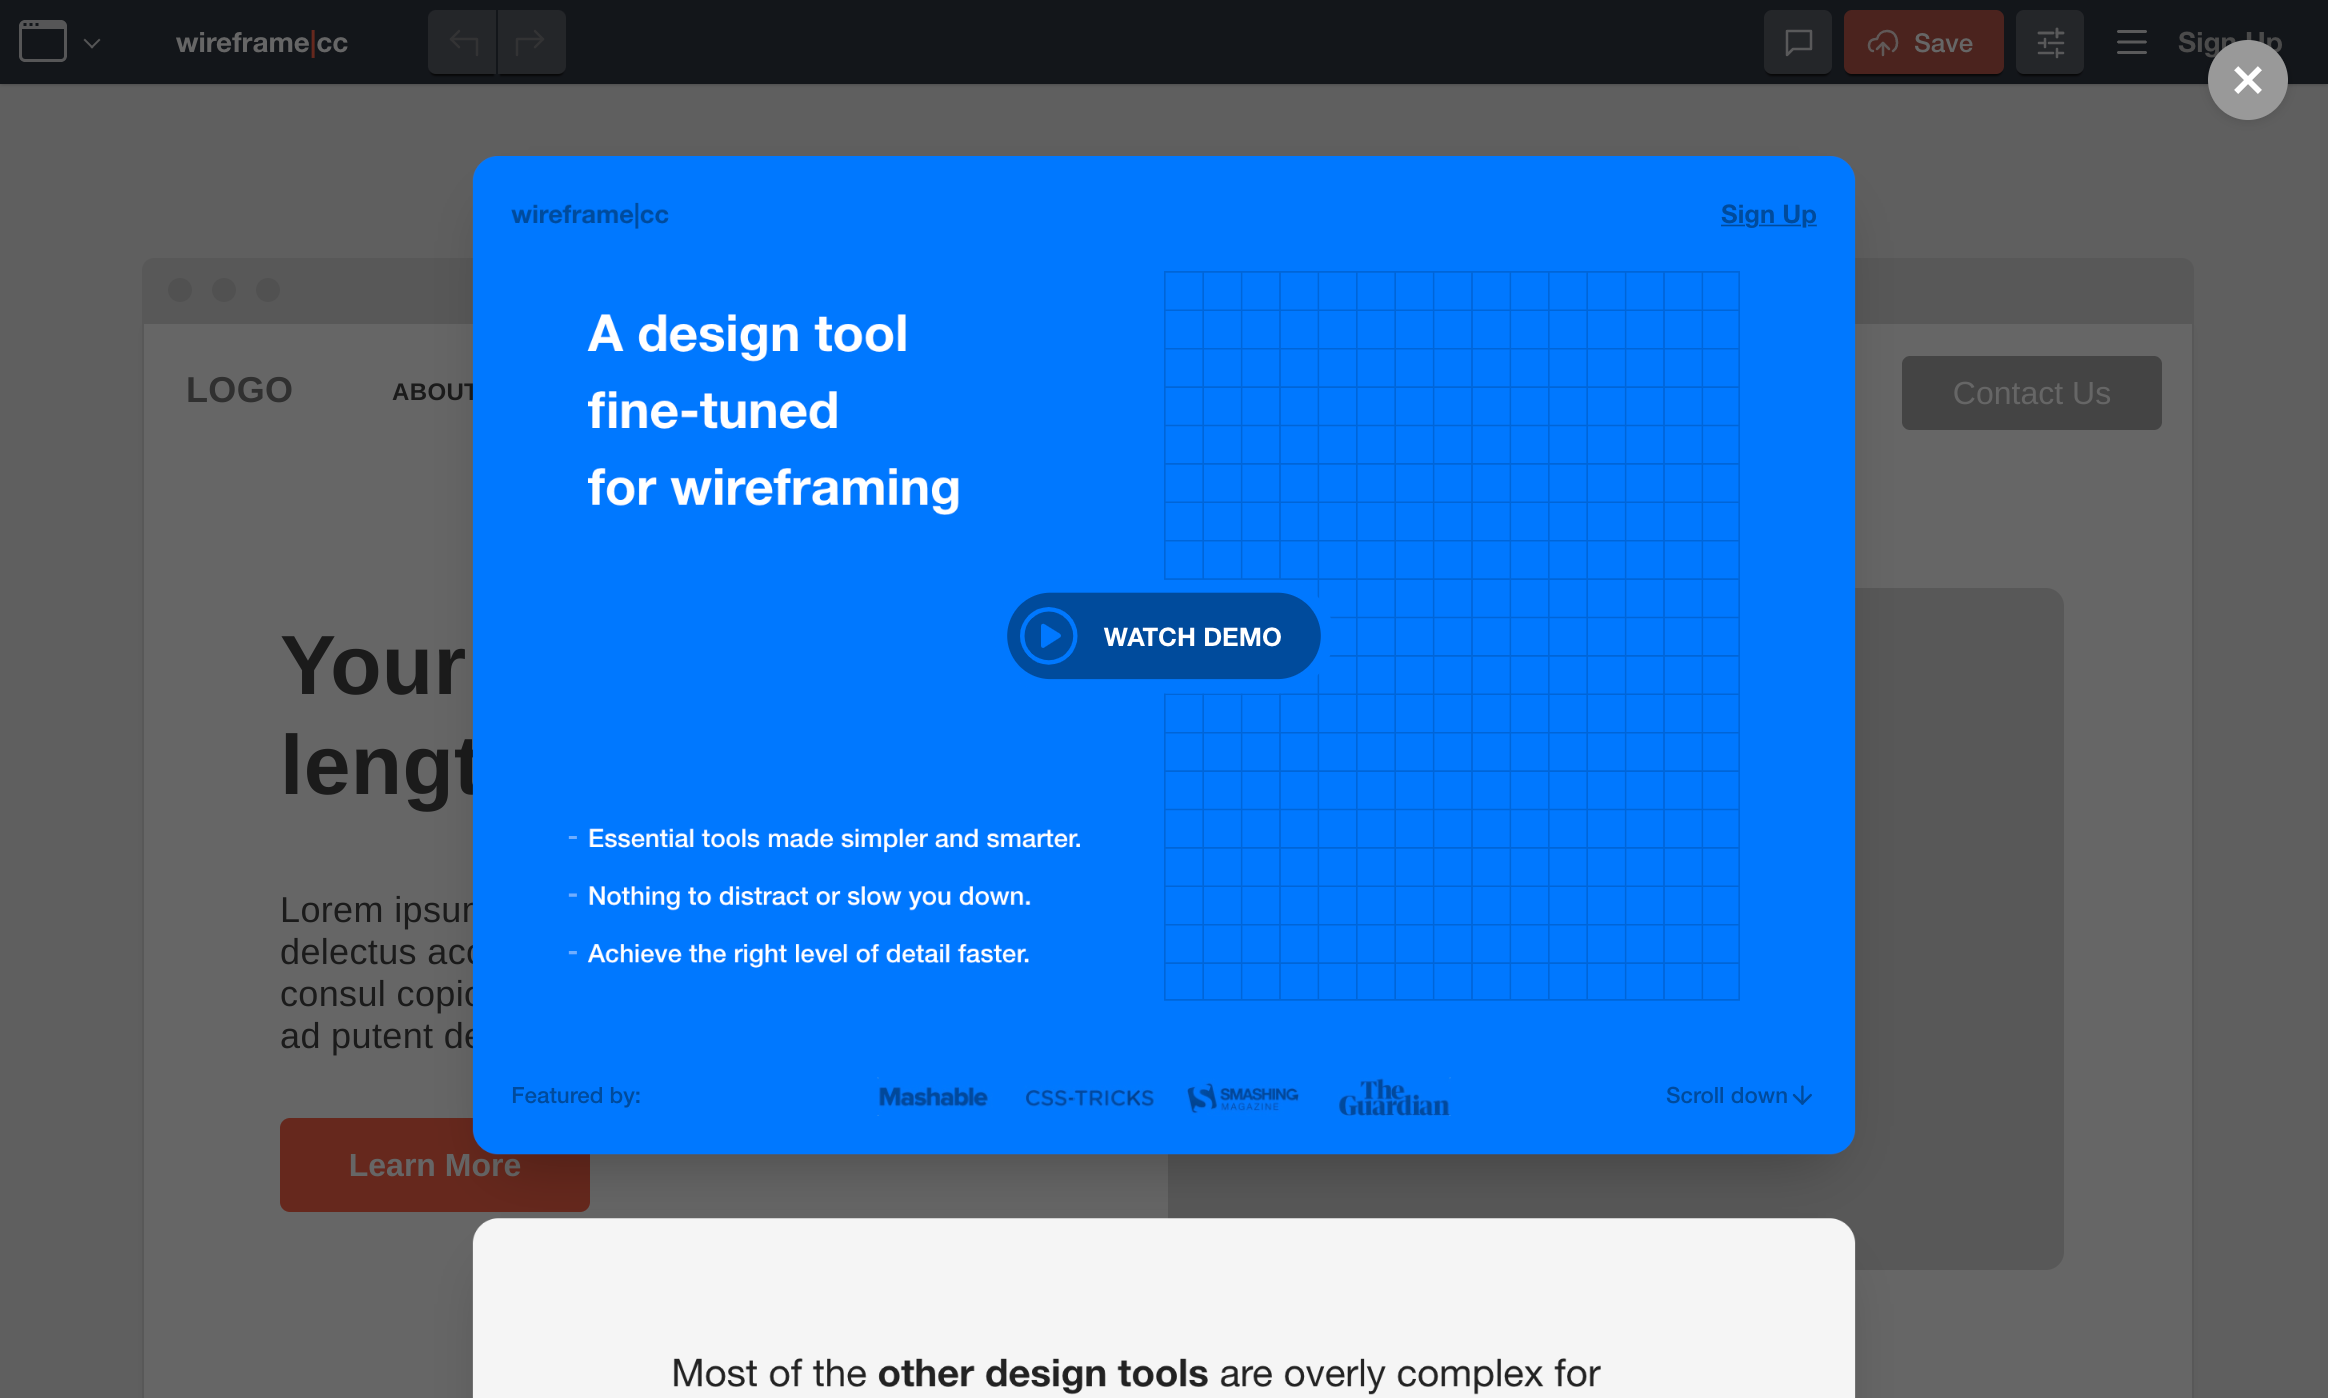
15. Wireframe.cc
Wireframe.cc is an innovative low-fidelity wireframing tool. Designers create and share better wireframes with a set of powerful, intuitive tools. With Wireframe.cc, you can quickly sketch out UI ideas, collaborate with teammates in real-time, and gather feedback before diving into code. Some key features include wireframing and prototyping, collaborative editing, and simple drag-and-drop tools.
Pros: Some key advantages of Wireframe.cc include:
– Intuitive drag-and-drop interface for quick wireframing
– Real-time collaboration so the whole team can provide feedback
– Versatile exporting options to move ideas into development
– Unlimited free plan for individual use and small teams
Cons: The main disadvantage is that as a low-fidelity tool, Wireframe.cc lacks sophisticated charting, styling, and prototyping features found in more full-featured products. It works best for early-stage ideation versus designing complete interactive prototypes.
Pricing: Wireframe.cc offers 3 paid plans in addition to a generous free plan:
– Basic: $9/month for 2 collaborators
– Professional: $24/month for 5 collaborators
– Business: $49/month for unlimited collaborators
With over 500k users, Wireframe.cc is one of the most popular wireframing tools available. It allows for unlimited collaborators and real-time co-editing on projects. Wireframes can be exported in both image and JSON format for easy handing off to developers.
Conclusion
In conclusion, the top organizational chart software cover a wide range of needs from free and open source options like OrgChartJS to robust paid solutions like SmartDraw and Lucidchart. Consider your specific requirements around collaboration, customization, security, integrations etc and shortlist a few options. Read real user reviews, test the free trials and choose the one that fits your team the best. Maintaining updated organizational charts is crucial for any organization and the right software tool can make the process seamless.