


Introduction
As data becomes increasingly important for insights and decision making, having the right data management software is critical. An effective solution can help organizations analyze data from various sources, gain useful business intelligence, and drive better outcomes. However, with so many options available, choosing the best one can be difficult. This guide reviews 15 top data management platforms based on key criteria to help you make an informed choice.
Methods of Evaluation
To evaluate and rank the top 15 solutions, we considered various factors like features and functionality, user experience, pricing, support, scalability, integration capabilities, and market presence. Beyond the core functionality, we also looked at other modern aspects like self-service capabilities, visualization, and machine learning integrations. In addition to evaluating based on vendor-provided information, we also factored in third party metrics like the number of backlinks, organic traffic and keyword search trends to understand the true market leadership.
1. IBM Cognos Analytics
IBM Cognos Analytics is a business intelligence and performance management platform developed by IBM. It provides capabilities for data management, predictive analytics, dashboards and reporting. IBM Cognos Analytics aims to give organizations a single view of business data and insights across their organization.
Pros: Some key advantages of IBM Cognos Analytics include: – Robust enterprise analytics server – Its analytics server provides robust capabilities for enterprise workflows, security and scalability. – Strong governance and administration – It provides tools for configuring roles, dashboards and workflows for easy administration and governance. – Excellent support and large customer base – IBM provides excellent customer support and the large customer base helps in peer learning and support.
Cons: One potential disadvantage of IBM Cognos Analytics could be its pricing which is on the higher side compared to other business intelligence tools in the market. The software licensing and ongoing support costs may not be suitable for all budgets.
Pricing: IBM Cognos Analytics pricing varies based on the required capabilities and number of users but generally starts from around $5,000 per user per year. It also offers flexible pricing models including on-premises perpetual licenses and software as a service (SaaS) subscription pricing. Contact IBM sales team for a customized quote based on your specific requirements.
Some key stats about IBM Cognos Analytics include: – It has over 20,000 customers globally including more than 50% of Fortune 500 companies. – The software comes pre-configured with 250+ reports, 50+ dashboards and 30+ metrics that can be immediately used. – It has over 300 connectors that allow querying of data from various sources like databases, cloud applications, big data platforms and more.
2. SAP Lumira
SAP Lumira is a data discovery and visualization tool from SAP that allows business users to explore, visualize, and share insights from data stored within SAP systems or other data sources. With its intuitive interface, Lumira is optimized for business users and analysts to uncover trends, patterns and exceptions in their data.
Pros: Some key advantages of SAP Lumira include:
– Visual data discovery tool optimized for SAP systems and data
– Tight integration and single login with SAP solutions for a unified experience
– Intuitive and easy to use interface makes data exploration simple for a business audience
– Collaboration features allow sharing of stories and insights across teams
Cons: A potential disadvantage of SAP Lumira could be its reliance on and optimization for SAP data sources. While it can connect to other data, the tight integration with SAP ecosystems may limit its appeal for organizations not heavily invested in SAP solutions.
Pricing: SAP Lumira is available through different pricing models depending on the needs and existing SAP investments of an organization. Pricing typically ranges from per user per month to enterprise agreements as part of broader SAP subscriptions and support contracts.
Some key stats about SAP Lumira include:
– Over 5,000 customers globally using Lumira
– Intuitive visual interface focused on ease-of-use for business users
– Tight integration with SAP data sources for a single version of the truth
– Cross-department and cross-organization sharing of insights

3. Tableau
Tableau is a leading data visualization and business intelligence software developed by Tableau Software. Founded in 2003, Tableau’s interactive data visualizations have helped organizations of all sizes make sense of their data.
Pros: Some of the main advantages of Tableau include: – Intuitive drag-and-drop interface that’s easy for business users to use for self-service analytics – Large library of templates and options for custom visualization building – Connects to various databases and cloud services for extracting and analyzing data – Strong community and training resources available to help users learn and advance their skills
Cons: One potential disadvantage is that Tableau has a subscriptions pricing model which can get costly at scale for very large deployments across many users.
Pricing: Tableau offers several paid subscription tiers for its software including: – Tableau Desktop (Personal Use): $35/month – Tableau Desktop (Creator): $70/month – Tableau Desktop (Analyst): $35/month – Tableau Server: Pricing starts at $1000/core/year for smaller deployments.
Some key stats about Tableau include: – Used by over 92,000 customer organizations including 90% of the Fortune 500 – Supported on Windows, Mac, Linux, iOS, and Android – One of the top business intelligence tools with over $3 billion in total funding raised
4. Elasticsearch
Elasticsearch is a distributed, open source search and analytics engine built on Apache Lucene. It allows storing, searching, and analyzing large volumes of data in near real-time. Elasticsearch is developed by Elasticsearch BV and its community. Elasticsearch was originally built ontop of Lucene for full-text search and is commonly used in applications requiring high scalability, performance, and availability such as content management, log analytics, fraud detection, and eCommerce systems. Elasticsearch is written in Java and is fully RESTful.
Pros: Key advantages of Elasticsearch include: Distributed search and analytics engine, Stores, analyzes and searches large volumes of data, Integrates with ELK stack and Logstash, Scalability and performance for large datasets
Cons: One potential disadvantage of Elasticsearch is that it requires hardware resources like memory, storage and CPU power to handle large datasets. Resources required scale up with the amount of data being indexed and analyzed.
Pricing: Elasticsearch has both open source and paid commercial licenses. The open source Basic license is free to use for commercial and non-commercial purposes. Paid subscription tiers like Gold and Platinum offer additional features like security, compliance, support, upgrades and cloud deployment.
Some key stats and facts about Elasticsearch include: It can store petabytes of data and handle over 50 billion requests per day. Elasticsearch is used by many large companies including Kroll, Stack Overflow, GitHub, and Udacity. It has over 47,000 watchers on GitHub and over 21,400 stars. Elasticsearch is open source and released under Apache License 2.0.
5. MongoDB
MongoDB is a general purpose, document-based, distributed database built for modern application developers and for the cloud era. MongoDB is flexible, scalable, and designed to deliver fast, reliable performance for mission-critical workloads.
Pros: Some key advantages of MongoDB include:
– Flexible and scalable for both relational and non-relational data
– Supports multi-model data with rich querying capabilities
– Integrates natively with popular languages and frameworks
Cons: One potential disadvantage is that MongoDB is a schema-less database, so it may not enforce data types and constraints as strictly as relational databases.
Pricing: MongoDB offers several pricing plans including:
– MongoDB Atlas (cloud hosting): Free tier and pay-as-you-go pricing based on data size and throughput.
– MongoDB Enterprise Advanced (on-premise): Annual subscription pricing starting at around $150 per server.
Some key stats about MongoDB include:
– Used by over 100,000 customers including Adobe, eBay, HSBC, and Yahoo
– Support for over 25 languages and frameworks like Node.js, Python, Java, and C#/.NET
– Scales from small single server deployments to large multi-petabyte clusters

6. Anaconda
Anaconda is a popular distribution of Python and R for data science. It comes pre-installed with over 200 of the most popular open-source packages for data science, machine learning, AI, and more. This makes Anaconda very easy to get started with for data science projects.
Pros: Some key advantages of Anaconda include:
– Distribution of Python and R for data science out of the box with popular packages pre-installed
– Easy environment and package management via the conda package and environment manager
– Cross-platform support allowing users to develop on Windows, macOS or Linux
Cons: One potential disadvantage is that as a large pre-built distribution, the size of Anaconda can be large taking up several gigabytes of storage. For some use cases a lighter weight Python installation may be preferable.
Pricing: Anaconda is freely available for academic, research and personal use under an open source license. For commercial use, Anaconda offers paid plans and enterprise support starting at around $9 per user per month.
Some key stats about Anaconda include:
– Over 100 million users worldwide
– Supported by Anaconda Inc, which employs over 150 people dedicated to open source Python and R
– Comes pre-installed with poplar packages like NumPy, Pandas, Scikit-Learn, Tensorflow, PyTorch and more

7. Qlik
Qlik is a leader in data integration, data quality and analytics. Qlik offers a powerful platform to ingest, consolidate, govern and analyze data to drive fact-based decisions. Qlik brings together data from various sources like databases, applications, cloud services and more to provide a unified view of data. Its associative data model allows for flexibility in analysis and exploring relationships in data.
Pros: Some key advantages of Qlik include:
– Associative data model that allows exploring data freely without constraints of joins or relationships
– Strong data governance and security capabilities to manage access to data
– Scalable platform that can handle large and complex datasets with ease
– Intuitive visualizations and dashboarding tools for self-service analytics
Cons: One potential disadvantage is that the platform requires significant time and resources to build complex data models and analytics applications from scratch.
Pricing: Qlik pricing is based on the number of metrics tracked in the data model (named Consumption Units or CUs). Basic plans start at $50 per user per month and custom enterprise plans are available based on usage and requirements.
Some key stats about Qlik include:
– Over 35,000 customer organizations globally across various industries like finance, manufacturing, retail etc.
– Supports over 500 connectors to ingest data from various sources
– Can handle datasets with billions of records and petabytes of data
– More than 100 pre-built analytics apps and templates for common use cases

8. Hitachi Vantara Pentaho
Hitachi Vantara Pentaho is a leading data integration and analytics platform from Hitachi Vantara. Pentaho offers powerful data integration, workflow, and reporting capabilities in a user-friendly interface.
Pros: Some key advantages of Hitachi Vantara Pentaho include:
– Leading open source analytics and data integration platform
– Powerful Extract-Transform-Load (ETL) and workflow capabilities
– Excellent for building custom and embedded analytics applications and dashboards
– Extensive community support and resources available
Cons: One potential disadvantage is that Pentaho may require more technical expertise to set up and configure complex ETL jobs and workflows compared to lower-code platforms.
Pricing: Pentaho offers both on-premise perpetual licenses as well as cloud-based subscription plans starting at $3,950 per year. Pricing varies based on the modules, user counts, and support levels required by each customer.
Some key stats about Hitachi Vantara Pentaho include:
– Used by over 10,000 companies globally
– Supports over 50 file formats and data sources
– Over 100 out-of-the-box connectors for databases, cloud services, and applications
– Processes petabytes of data each day

9. Neo4j
Neo4j is an open-source, native graph database developed by Neo4j, Inc. It is the world’s leading graph database platform and is optimized for storing and querying connected data at scale. Unlike traditional databases that force data into rows and columns, Neo4j is built to leverage relationships as first-class objects. With Neo4j, data is stored and traversed using highly optimized graph algorithms. This allows for incredibly fast queries even on huge datasets with billions of connections.
Pros: Some key advantages of Neo4j include:
– Industry leading graph database optimized specifically for connected data
– Efficiently stores and queries graph datastructures using an innovative property graph model
– Powerful and flexible Cypher graph query language
– Seamless integration with modern applications and easy to learn and use
Cons: One potential disadvantage is that Neo4j is a specialized graph database which may require more developer training compared to a general purpose SQL database.
Pricing: Neo4j offers different pricing tiers depending on needs and use cases. The open source Community Edition is free to use for non-commercial purposes. Paid subscriptions start at $199/month for small production workloads and scale up based on data size and usage.
Some key stats about Neo4j:
– Used by over 50,000 customers including global brands like IBM, Adidas,Spotify, American Airlines, Walmart
– Performs up to 100x faster queries vs traditional databases for connected data due to optimized graph algorithms
– Can scale to billions of nodes and relationships on a single machine
10. InfluxDB
InfluxDB is an open source time series database developed by InfluxData. It is optimized for fast, cost-effective storage and retrieval of time series data in areas like operations monitoring, application metrics, Internet of Things sensor data, and real-time analytics. Some key capabilities of InfluxDB include handling high write and query loads, working with any data type, and integrating with common DevOps and monitoring tools.
Pros: Key advantages of using InfluxDB include:
– Time series database optimized for storing and analyzing IoT, metrics and sensor data
– High performance and scalability to handle large volumes of time-stamped data
– Integrates with common monitoring and DevOps tools like Prometheus, Grafana and Kubernetes
– Provides visualization and analytics capabilities through built-in functions and dashboards
Cons: One potential disadvantage is that InfluxDB is focused only on time series data and may not be the best fit if you need a general purpose database.
Pricing: InfluxDB has both open source and commercial pricing tiers. The open source version is free to use while the commercial tiers are priced based on data volume and features.
Some key stats about InfluxDB include:
– Handles over 1000 writes per second
– Queries data in sub-millisecond times
– Supports schema-less data model to handle variety of metrics
– Used by Fortune 500 companies and millions of developers

11. Klipfolio
Klipfolio is a business intelligence and analytics platform that allows users to create interactive dashboards and reports without any coding. Founded in 2012 and headquartered in Vancouver, Canada, Klipfolio allows both individuals and teams to gain insights from their data to make better decisions.
Pros: Some key advantages of Klipfolio include:
– Easy drag-and-drop dashboard builder that doesn’t require any coding knowledge
– Strong mobile accessibility with dashboard viewing and editing capabilities on iOS and Android
– Built-in collaboration features like dashboard sharing, comments, and activity feeds
– Flexible integration options to embed dashboards across websites, apps, and other platforms
Cons: One potential disadvantage is that the free tier only allows for a single user and has limited storage, so it may not be suitable for larger teams without upgrading to a paid plan.
Pricing: Klipfolio offers 3 paid plans – Team, Business, and Enterprise. Pricing starts at $20/user per month for the Team plan which supports up to 5 users.
Some key stats about Klipfolio include:
– Used by over 5000 companies worldwide including 23 of the Fortune 100
– Integrates with over 100+ apps including Google Analytics, Salesforce, QuickBooks, and more
– Supports various data types including metrics, charts, maps, financial reports, and more
12. Sisense
Sisense is a cloud-based data management and analytics platform that was founded in 2004. It helps businesses turn their data into insights through interactive dashboards, reports and alerts. With Sisense, companies can analyze both structured and unstructured data from various sources like databases, data warehouses, CRM systems and more.
Pros: Key advantages of Sisense include:
– Fast query performance on massive data sets
– Robust machine learning and AI capabilities like automatic data preparation and anomaly detection
– Easy to deploy and scale analytics using its cloud platform
Cons: One potential disadvantage is that the more advanced features require an enterprise subscription which can be expensive for some smaller businesses.
Pricing: Sisense offers several pricing tiers including free and paid plans. The free developer edition allows for up to 3 users. Paid plans start at $50 per user per month for the basic plan and scale up based on additional features, support levels and data/query volumes.
Some key stats about Sisense include:
– Supported by over 100,000 users worldwide
– Processes billions of queries per day
– Supports over 50 connectors for importing and analyzing various data sources

13. Looker
Looker is a data management and business intelligence tool that helps customers explore, share and embed insights from their data. Founded in 2011 and headquartered in Santa Cruz, California, Looker is one of the leading platforms for business intelligence, data applications and embedded analytics. Over 1800 customers globally use Looker to deliver data and analytics to over 500,000 end users every day.
Pros: Some key advantages of Looker include:
– Developer-friendly centralized BI platform that allows building powerful analytic applications at scale
– Large ecosystem of over 180 pre-built connectors and integrations with tools like Google Analytics, Marketo, Salesforce etc.
– Great for embedded analytics use cases through its SDKs and APIs for integrating Looker analytics in websites and apps
Cons: One potential disadvantage of Looker could be its price which ranges from $1500/month for the starter tier to over $50,000/month for the top-tier enterprise plan depending on the number of users and usage. This makes it more expensive compared to open-source alternatives.
Pricing: Looker offers the following pricing tiers:
– Starter: $1500/month for up to 3 users
– Growth: $3750/month for up to 10 users
– Business: Custom pricing for 11-100 users
– Enterprise: Custom pricing for more than 100 users
Some key stats about Looker include:
– Over 1800 customers globally in industries like ecommerce, finance, healthcare and technology
– Supports over 50 database sources including MySQL, PostgreSQL, Redshift, Snowflake etc.
– Has over 500,000 daily active end users on its platform
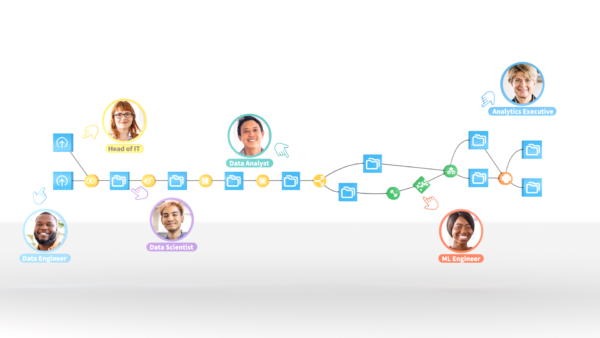
14. Dataiku
Dataiku is an end-to-end machine learning and data science platform created in Paris, France. Founded in 2013, Dataiku’s platform enables companies to build and deploy predictive analytics applications and AI solutions. With over 400 employees worldwide, Dataiku is used by many global enterprises and governments.
Pros: Some key advantages of the Dataiku platform include:
– End-to-end machine learning platform that supports the full data science lifecycle from data prep to modeling to deployment.
– Visual collaboration tools and streamlined workflows allow data scientists, developers, and business users to work together seamlessly.
– Lifecycle management of ML models to ensure regulatory compliance, reproducibility, and governance of models.
– Support for various data sources including SQL, NoSQL, CSV/text files as well as programming languages like R, Python, and Scala.
Cons: A potential disadvantage is that the platform requires more technical expertise compared to point solutions and may not be suitable for smaller businesses or those just getting started with AI/ML.
Pricing: Dataiku offers several pricing plans including a free Community Edition. For commercial use, Pricing starts at $1,500/user/month for the Basic plan and scales up based on user count and additional features required.
Some key facts about Dataiku include:
– Used by over 250 enterprises globally including GE, L’Oréal, and Schneider Electric.
– Raised over $290M in funding to date from top investors like ICONIQ, Battery Ventures, and Goodwater Capital.
– Recognized as a leader in the 2022 Gartner Magic Quadrant for Data Science and ML platforms.
Conclusion
While there is no single best option, this guide covers some of the most popular and capable data management software on the market today. The right choice depends on your unique business needs, budget, data landscape, and team expertise. We hope this evaluation of the top 15 solutions based on important criteria helps you shortlist the most suitable options for powering your analytics and gaining actionable insights from data.