


Introduction
Financial analysis software has become mission critical for businesses of all sizes as data volumes continue to grow exponentially and the need for real-time insights increases. However, with so many options on the market, it can be difficult to determine which solutions are best suited for your unique needs and capabilities. This guide evaluates the leading financial analysis tools based on functionality, user experience, integration capabilities, pricing, and other factors to help you make an informed decision.
Methods of Evaluation
To determine the top 15 financial analysis software solutions of 2023, each product was evaluated based on the following criteria: features and functionality, ease of use, customization options, reporting capabilities, analytics and visualization tools, partnerships and integrations, customer reviews, pricing and plans, and other qualitative factors like brand recognition and popularity based on website traffic and number of backlinks. Quantitative metrics like traffic and keyword trends were also referenced to ensure the highest ranking companies were well established in the industry.
1. Adobe Analytics
Adobe Analytics, formerly known as Omniture, is a leading web analytics and digital marketing software solution developed by Adobe Inc. Founded in 1996, Adobe Analytics helps companies better understand user behavior on their websites and digital properties to improve marketing ROI.
Pros: Key advantages of Adobe Analytics include:
– Deep integrations and analytics for digital properties
– Ability to test and optimize experiences using behavioral data
– Advanced segmentation and marketing automation capabilities
Cons: One potential disadvantage is the pricing, as Adobe Analytics is aimed at large enterprises and its plans and pricing can be expensive for some small to medium-sized businesses.
Pricing: Adobe Analytics pricing starts at $150 per month for a standard plan with features like basic reports, segmentation, and limited data storage. For larger enterprises, customized enterprise plans with additional features are available ranging from thousands to tens of thousands per month.
Some key facts about Adobe Analytics include:
– Over 25,000 customers globally including most Fortune 500 companies
– Processes over 1 trillion web and mobile events per month
– Integrates with other Adobe products like Adobe Experience Cloud for deeper analytics

2. IBM Planning Analytics
IBM Planning Analytics, formerly known as IBM Cognos Planning, is a cloud-based financial planning and analysis software created by IBM. It provides integrated financial modeling, planning, budgeting, forecasting and reporting capabilities to help organizations streamline their financial processes.
Pros: Some key advantages of IBM Planning Analytics include its high level of customization using click tools without any coding, robust analytics and reporting capabilities, and tight integration with other IBM products like Cognos Analytics for reporting.
Cons: A potential disadvantage is that IBM Planning Analytics is only available as a cloud-based software-as-a-service solution and not as an on-premise installation, which some organizations may prefer.
Pricing: IBM Planning Analytics pricing is based on the number of users, with starting prices of $150/user/month for the Professional edition.
Some key stats about IBM Planning Analytics include: it powers the financial planning of over 5,000 organizations globally, it integrates seamlessly with other IBM products like Cognos Analytics for reporting, and it is highly customizable using click tools without any coding required.
3. BusinessObjects
BusinessObjects is a business intelligence software suite developed by SAP. It provides features such as reporting, dashboarding, analytics, consolidation and modeling to help businesses gain insights from their data.
Pros: The main advantages of BusinessObjects include: – Robust reporting and dashboarding capabilities to visualize data – Advanced analytics capabilities like predictive modeling and data mining – Strong consolidation and modeling functionality to calculate actuals, budgets and forecasts
Cons: A potential disadvantage of BusinessObjects is that it requires substantial time and resources to implement fully due to its complexity and breadth of functionality.
Pricing: BusinessObjects pricing varies based on the number of users, modules, and type of deployment (on-premise or cloud). It has both annual subscription and perpetual licensing options. Contact SAP sales for a customized quote.
Some key stats about BusinessObjects include: – Over 33,000 customers worldwide across various industries – Supports analysis of structured and unstructured data from multiple sources – Integrates with various data sources including SAP and non-SAP applications

4. Tableau
Tableau is a business intelligence and analytics software developed by Tableau Software. Founded in 2003, Tableau helps people see and understand data through intuitive drag-and-drop visualizations. With powerful yet easy-to-use analytical tools, Tableau has become one of the leading platforms for self-service business intelligence.
Pros: Some key advantages of Tableau include:
– User friendly interface makes it easy for analysts of all skill levels.
– Powerful visualization and reporting capabilities that let you visualize data in histograms, maps, scatter plots, tree maps and more.
– Supports live data connections and is well prepared for self-service analytics where anyone can ask questions of data and get answers without IT assistance.
– Cross-platform support allows users to view and interact with visualizations on Windows, Mac, iOS, and web.
Cons: One potential disadvantage is that Tableau has a steep learning curve to unlock its full analytical potential. While easy for basic visualization, advanced features like calculations, parameters, and data blending require tutorials and practice to use effectively.
Pricing: Tableau has several pricing options depending on needs. The standard licenses start at $35 per user per month for the Tableau Desktop Personal edition. Other options include Server pricing at $35/user/month and Site-Wide Licenses for enterprise deployments.
Some key stats about Tableau include:
– Used by more than 93,000 customer organizations globally including Intel, Verizon, and Netflix.
– Supports over 50 common database sources including Excel, SQL Server, PostgreSQL, and Hive.
– Can visualize billions of rows of data with blazing fast speed.
– Tableau Public is free to use and a great option for learning and sharing visualizations online.
5. Wolters Kluwer
Wolters Kluwer is a global provider of professional information, software solutions, and services. Their flagship financial analysis software, called Aurora Vision, leverages over 30 years of domain expertise to provide robust capabilities for financial planning, analysis and reporting.
Pros: Some key advantages of Aurora Vision include: – Strong capabilities for large enterprises with complex requirements – Comprehensive set of financial controls and workflows to ensure compliance – Advanced predictive analytics and ‘what-if’ modeling capabilities to inform strategic decision making
Cons: A potential disadvantage is that the software is more suited for larger enterprises given its robust feature set and typically requires dedicated implementation resources for setup which can increase costs.
Pricing: Aurora Vision pricing is typically sold through an annual subscription model starting at $50,000 per year based on number of users, modules, customization requirements, and support levels.
Some key stats about Aurora Vision include: – Used by over 5,000 enterprises globally including 80% of Fortune 500 companies – Supports over 1,000 users simultaneously – Integrates data from over 400 ERP systems out of the box – Provides pre-built connectors to over 30 leading accounting and ERP systems
6. Qlik
Qlik is a leader in data integration, analytics, and data visualization. Founded in 1993, Qlik’s vision is to create a data-literate world, one where everyone can use data to solve their most challenging problems. Qlik provides data integration, data quality, and analytics solutions to help organizations access and analyze all their data no matter where it resides.
Pros: Some key advantages of Qlik include:
– Associative engine allows for complex searches and analysis across all data with associative queries
– Intuitive interface optimized for business users with simple drag-and-drop capabilities
– Embedded analytics capabilities via APIs allowing for custom applications and dashboards
Cons: One potential disadvantage is the learning curve for more complex queries and analytics compared to some other options
Pricing: Qlik pricing models include perpetual and subscription licenses. Pricing is based on the number of document loads and users. Startups and small businesses can get started with Qlik Sense Business for $50 per month.
Some key stats about Qlik include:
– Used by over 48,000 customers worldwide across all industries
– Supports over 500 integrated data sources for unified data access
– Named a Leader in the 2021 Gartner Magic Quadrant for Analytics and Business Intelligence Platforms for the 12th consecutive time

7. Domo
Domo is an all-in-one data experience platform that makes business data easy to understand through visualizations and dashboards. Founded in 2010 and headquartered in American Fork, Utah, Domo serves over 3,000 customers worldwide spanning various industries.
Pros: Some key advantages of Domo include:
– All-in-one platform bundles data preparation, visualization and more into a single solution
– Intuitive and easy to use interface built for executive-level decision making
– Mobile friendly experience with a responsive design for on-the-go access
– Automatic updates and upgrades ensure you always have the latest features
Cons: One potential disadvantage of Domo is the pricing, as it is an enterprise-grade solution aimed at large organizations with substantial data and analytics needs. For smaller businesses or those with limited budgets, Domo may be overkill and an over-investment.
Pricing: Domo offers flexible pricing plans tailored to organizations of different sizes and needs. Pricing is typically based on number of user licenses and data volume. Contact a Domo sales representative for a custom quote.
Some key stats about Domo include:
– Used by over 3,000 customers worldwide across various industries
– Integrates data from over 150 sources including Google Analytics, Salesforce, Oracle, etc.
– Supports over 100 languages for localization
– Built-in predictive algorithms and machine learning capabilities

8. Klipfolio
Klipfolio is business dashboard and analytics software that allows users to build customized visual dashboards and reports. Founded in 2011 and headquartered in Vancouver, Canada, Klipfolio helps individuals and teams across various industries make informed decisions using their data.
Pros: Some key advantages of using Klipfolio include:
– Visual dashboard and reports builder for intuitive data storytelling
– Powerful analytics capabilities for slicing, dicing and analyzing data
– Highly customizable to connect any data source and build custom dashboards
Cons: One potential disadvantage is that the customizability may require some technical skills to fully leverage all its capabilities. Certain complex analytics queries or automations may require assistance from developers or consultants.
Pricing: Klipfolio offers different pricing plans depending on the number of users and advanced capabilities needed. Pricing starts from $15 per user per month for the basic plan and goes up to $35 per user per month for the premium plan.
Some key stats about Klipfolio include:
– Used by over 8,000 companies worldwide including startups, SMBs and large enterprises
– Integrates with over 150+ data sources including Google Analytics, QuickBooks, and more
– Supported more than 30 report styling options and charts/graphs for data visualization
9. Lumen
Lumen is a financial analysis software that leverages AI and machine learning to help businesses gain financial insights. Using Lumen, companies can perform in-depth cost accounting, conduct profitability analysis, and make strategic decisions based on dynamic driver-based cost allocation.
Pros: Some key advantages of Lumen include:
– Powerful cost accounting and analysis capabilities that provide a holistic view of costs
– Robust profitability modeling features to understand profit drivers and non-profit areas
– Flexible driver-based cost allocation that links costs to activities intelligently
Cons: The only potential disadvantage is the learning curve for more advanced features, but the UI is designed to be intuitive and the company provides training and support.
Pricing: Lumen offers flexible pricing plans starting from $99/month for the basic plan up to an enterprise plan customized for larger businesses. Pricing is based on the number of users, cloud storage needs, and additional support required.
Some key stats about Lumen include:
– Used by over 5,000 companies worldwide
– Integration with accounting platforms like QuickBooks, Xero, Sage etc.
– Provides visibility into finances within 24 hours of upload
– Automates 95% of analysis processes

10. Sisense
Sisense is a leading business intelligence and analytics platform. Founded in 2004, Sisense helps companies turn complex data into actionable insights. With its headquarters in New York, Sisense has thousands of customers globally across industries like finance, manufacturing, retail and more. The platform allows users to connect diverse data sources, build dashboards and reports, and share insights across their organizations.
Pros: Some key advantages of the Sisense analytics platform include:
– Simplified wizard interface for easy visualization creation without code
– AI assisted features like natural language queries to analyze data
– Support for big data via its in-memory processing engine for fast queries
– Integrations and connectors for diverse data sources and systems
Cons: One potential disadvantage is that the more advanced customization and development features require knowledge of SQL and coding, which may not be suitable for all user types.
Pricing: Sisense offers various pricing plans depending on the modules and features needed. The pricing ranges from free plans for developers and small teams to enterprise plans customized for large deployments. It also provides monthly, annual and perpetual license options.
Some key stats about Sisense include:
– Supported over 2,000 customers worldwide
– Processes over 1 petabyte of data daily
– Over 10,000 active monthly users
– Integrated with over 50 different data sources like SAP, Salesforce, MongoDB etc.

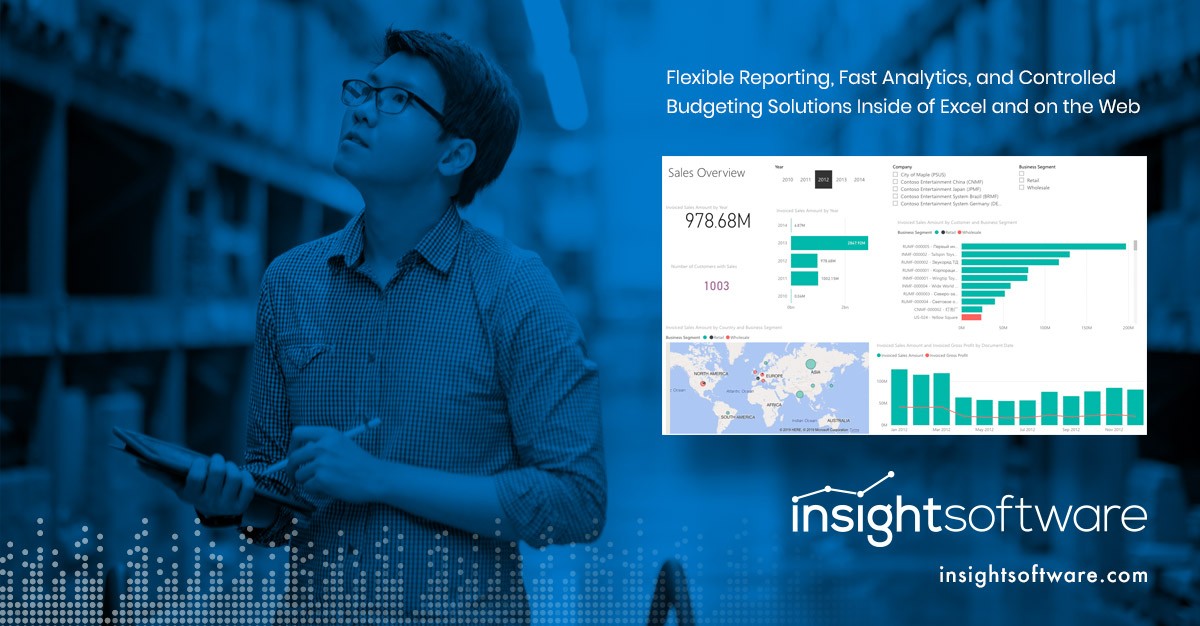
11. Insightsoftware
Insightsoftware is a finance-owned software company that provides financial analysis and reporting tools. Founded in 1978, Insightsoftware helps organizations leverage their existing financial systems to speed up processes, increase accuracy, and encourage wider participation.
Pros: Some key advantages of Insightsoftware include:
– Powerful consolidation solution that handles complex reporting needs for multi-divisional companies.
– Advanced analytics and modeling capabilities to gain insights from financial data.
– Flexible platform that can scale to meet the needs of large multi-entity organizations.
Cons: Potential disadvantages could include a steeper learning curve for users unfamiliar with advanced financial modeling or consolidation workflows.
Pricing: Pricing varies depending on the specific solutions, number of users, and required functionality. Contact Insightsoftware for a custom quote.
Insightsoftware supports over 25,000 companies globally and connects with over 140+ ERP and EPM solutions. It offers flexible reporting, fast analytics dashboards, and controlled budgeting solutions that can be used within Excel or through a web interface.
12. Looker
Looker is an enterprise-grade business intelligence and analytics platform that allows users to connect to diverse data sources and build interactive dashboards, reports and applications for exploring and sharing insights. Founded in 2012, Looker was acquired by Google in 2019 and is now part of Google Cloud.
Pros: Some key advantages of Looker include:
– Business friendly interface optimized for data exploration instead of technical queries
– Extensive library of connectors allowing connection to various data sources within the enterprise
– Advanced functionality including custom formulas, aggregates and filters for powerful analytics
Cons: One potential disadvantage is that the more advanced functionality may have a learning curve for casual users unfamiliar with business intelligence platforms.
Pricing: Looker pricing starts at $150 per user per month for the Standard plan but varies based on data storage, licenses, support and other custom requirements. Discounts are available for annual commitments and enterprise-level deals with Google Cloud.
Some key stats about Looker include:
– Used by over 2500 customers globally including Uber, Netflix, Buzzfeed
– Connects to over 45 different database types including MySQL, PostgreSQL, Amazon Redshift, Google BigQuery
– Over 500 pre-built connectors for seamless integration with applications like Salesforce, Marketo, Google Analytics
13. Unit4FP&A
Unit4FP&A is a financial analysis and planning software developed by Unit4, a global enterprise software company. Unit4FP&A allows finance teams to centrally manage budgets, forecasts, reporting and more in one integrated system.
Pros: Some key advantages of Unit4FP&A include: Integrated FP&A and accounting allows seamless data sharing and reporting. Advanced cost accounting capabilities with flexible driver-based allocations. Flexible consolidations that support both standard and advanced workflows.
Cons: A potential disadvantage is that as an integrated suite, switching costs may be higher than some best-of-breed or focused FP&A solutions. Training and adoption of all modules may also require more effort for some organizations.
Pricing: Unit4FP&A pricing is customizable based on number of users, modules, services, and other factors. Generally it is priced as an annual subscription based on whether the customer needs standard vs premium support and functionality.
Some key stats about Unit4FP&A include: used by over 6,000 customers worldwide in industries like professional services, non-profit, government, and more. Integrates financial data from over 40 ERP systems. Allows complex multi-dimensional reporting on both business data and finances.

14. Vendasta
Vendasta is a cloud-based platform that provides agencies, web publishers and marketing teams with tools to build, manage and monitor digital marketing campaigns. Founded in 2004 and headquartered in Saskatoon, Canada, Vendasta aims to help digital sales and marketing professionals grow their business through its software and services.
Pros: Some key advantages of using Vendasta include:
– Agencies, web publishers and marketing teams can gain access to 100s of products and services to sell at scale.
– Track campaigns, performance and ROI with built-in analytics and reporting tools.
– Embedded analytics and reporting tools to gain insights into campaign and partner performance.
Cons: One potential disadvantage is that the platform may not be suitable for very large enterprises with complex requirements, as it is primarily designed for digital agencies, marketing teams and publishers.
Pricing: Vendasta offers a freemium model where users can get started for free. For additional features, plans start at $99 per month for 10 seats.
Some key stats about Vendasta include:
– Over 30,000 reseller partners in more than 100 countries
– Supports over 100 products including website builders, CRM tools, online stores and more
– Tracks over $1B in annual revenue generated through its reseller network

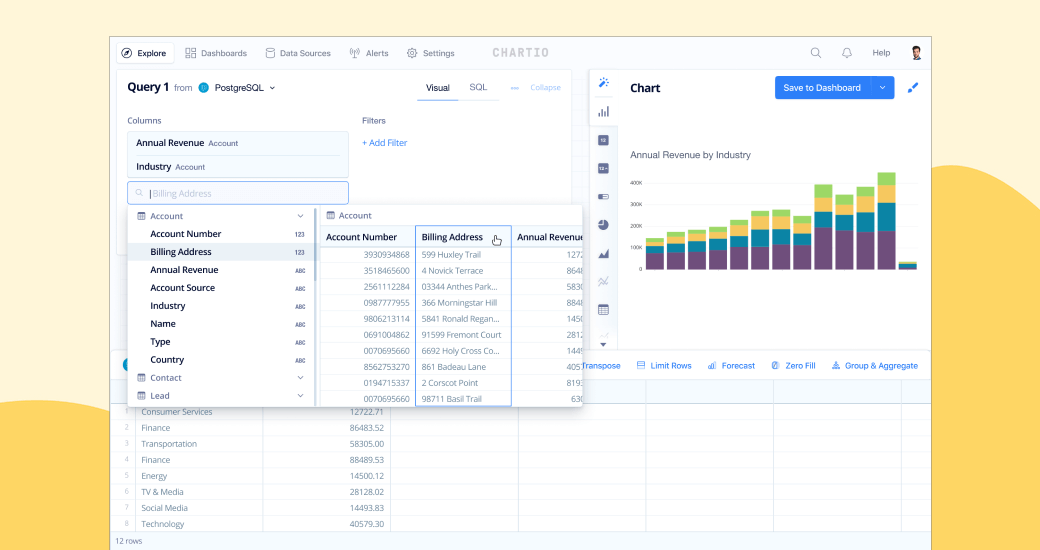
15. Chartio
Chartio is a cloud-based business intelligence and analytics platform. Founded in 2015, Chartio aims to enable everyone within an organization to easily analyze and understand their business data, regardless of technical experience or data science skills. With pre-built connectors to popular SaaS applications and databases, Chartio allows users to instantly access, visualize and share insights from their core business systems.
Pros: Some key advantages of Chartio include:
– Fully managed Software-as-a-Service model so no infrastructure to maintain
– Intuitive drag-and-drop interface enables self-service analytics for all skill levels
– Wide range of data manipulation and visualization widgets including charts, filters and dashboards
Cons: One potential disadvantage is that the platform lacks some more advanced data engineering functionality found in on-premise business intelligence tools. As a purely cloud-based solution, users have less control over the underlying infrastructure compared to an on-premise deployment.
Pricing: Chartio offers the following paid plans:
– Individual Contributor: $49/user/month
– Team: $99/user/month
– Business: Customized enterprise pricing
All plans include standard features like connected data sources, visualizations and sharing. The Team and Business tiers provide additional functionality for larger deployments like governance controls and SSO.
Some key stats about Chartio include:
– Used by over 1,500 companies worldwide including Spotify, Twilio and Anthropic
– Connects to over 50 different cloud data sources including Salesforce, Google Analytics and Stripe
– Offers 100GB of monthly ingestion at the standard pricing tier
Conclusion
Complex financial analysis is critical for powering data-driven decisions in today’s digital-first business world. The tools ranked here were chosen as leaders based on comprehensive evaluations of features, usability, customization, reporting prowess, and other considerations important for driving insights. While no single solution will be a perfect fit for all, this guide provides a strong starting point for evaluating the top financial analysis platforms that can help maximize your organization’s performance.