Introduction
Business intelligence and analytics have become crucial for organizations to gain insights from their data and make informed decisions. However, with so many BI and analytics tools on the market, it can be difficult to determine the right solution. This blog evaluates 15 leading platforms across various criteria to help identify the top options. We analyzed each platform’s functionality, market presence, and customer reviews to compile this list of the best analytics software for 2023.
Methods of Evaluation
To evaluate and rank the platforms, we considered the following factors: features and capabilities, customer reviews and ratings, website traffic and domain authority (based on number of backlinks), keyword trend data to assess rising interest, and market presence in terms of customer base and revenue. Specifically, we looked at capabilities for data visualization, reporting, predictive analytics, ease of use, security, pricing, and supported data sources. We also analyzed reviews on third-party sites like G2, TrustRadius and Capterra. Traffic and backlink data helped ascertain the platform’s online reputation. Finally, we factored in overall market leadership in terms of customer base and revenue to determine the top solutions.
1. Adobe Analytics
Adobe Analytics, previously known as Adobe Analytics, is a web analytics solution developed by Adobe Inc. It provides insights into customer behavior across digital marketing channels like websites, mobile apps, video and more. Founded in 1982, Adobe is a leader in digital media and digital marketing software.
Pros: Some key advantages of Adobe Analytics include:
– Powerful reporting and segmentation capabilities to analyze customer behaviors at scale.
– Cross-channel analytics and ability to optimize content across channels based on insights.
– Unified data and centralized reporting across Adobe products for a holistic view of the customer journey.
Cons: One potential disadvantage is the cost as it is an enterprise-level solution priced based on number of annual visitors/traffic. It may not be suitable for smaller businesses or those on tighter budgets.
Pricing: Adobe Analytics pricing starts at around $150 per month for the basic plan suited for small businesses with up to 1 million annual visitors. Mid-sized businesses may need the mid-tier plan starting at $500 per month and supporting up to 5 million visitors annually. For large enterprises, customized enterprise pricing is available based on needs and volume.
Some key stats about Adobe Analytics include:
– Used by over 25,000 companies worldwide including top brands like Coca-Cola, Delta Airlines, eBay, Home Depot, McDonald’s etc.
– Processes over 35 trillion events and 5 trillion page views per month from customers globally.
– Integrates data across Adobe Experience Cloud products like Adobe Experience Manager, Adobe Target, Adobe Campaign etc.
2. IBM Cognos Analytics
IBM Cognos Analytics is a business intelligence and performance management software developed by IBM. It provides capabilities for data preparation, reporting, dashboards, and visual data discovery across desktop and mobile devices. The platform integrates with various IBM products including IBM Watson for enhanced analytics.
Pros: Some key advantages of IBM Cognos Analytics include: – Enterprise BI platform with data governance and security controls – Intuitive data visualizations and self-service analytics capabilities across desktop and mobile – Provides AI and analytics capabilities through integration with IBM Watson and other IBM products
Cons: A potential disadvantage is that as an enterprise product, IBM Cognos Analytics has a relatively higher upfront licensing cost compared to some other alternatives in the market.
Pricing: IBM Cognos Analytics pricing varies based on the number of users, hardware requirements, and additional modules. Contact IBM sales representative for a customized quote based on your specific business needs and requirements.
Some key stats about IBM Cognos Analytics include: – Used by over 30,000 customers worldwide across various industries – Supports desktop, web and mobile usage – Integrates with over 50 different data sources including databases, big data, spreadsheets and cloud applications.
3. Salesforce Einstein Analytics
Salesforce Einstein Analytics is Salesforce’s business intelligence and analytics platform. It provides embedded analytics capabilities within the Salesforce CRM platform to give insights based on customer data.
Pros: Some key advantages of Salesforce Einstein Analytics include: – Embedded analytics in Salesforce CRM allows a holistic view of customers – Predictive insights and recommendations based on analyzing large customer data – Intuitive visualizations, reports and dashboards for various users and roles
Cons: A potential disadvantage could be the dependency on Salesforce CRM/platform – the analytics are tightly coupled with Salesforce and may not be useful for standalone analytics needs
Pricing: Pricing for Salesforce Einstein Analytics varies based on the edition and number of users. It is available in Developer, Team, and Enterprise editions starting at $300-1000 per user per year.
Some key stats about Salesforce Einstein Analytics include: – Used by over 150,000 companies globally – Processes over 6 trillion analytics requests per month – Provides reports and dashboards for various roles like sales, marketing, customer service etc.
4. Tableau
Tableau is a business intelligence and analytics software developed by Tableau Software. It helps organizations turn complex data into understandable visuals with its intuitive drag-and-drop interface.
Pros: Some key advantages of Tableau include:
– Intuitive visual analytics for easy data exploration and business intelligence
– Powerful yet simple dashboards that can be viewed on web, desktop or mobile
– Self-service analytics allows non-technical users to analyze and understand data
Cons: One potential disadvantage is that the desktop version of Tableau requires a paid license for each user, which can increase costs for large deployments.
Pricing: Tableau offers monthly and annual subscription plans for its online and server products starting at $10/user/month. Pricing for the desktop version starts at $999/year for the Pro edition.
Some key stats about Tableau include:
– Used by more than 92,000 customer organizations
– Over 1.5 million users worldwide
– Integrates with over 60 different databases
– Supports both desktop and online/server versions
5. Matomo
Matomo is a free open-source web analytics platform that offers businesses and organizations an ethical alternative to Google Analytics. Originally named Piwik, Matomo allows you to understand your website traffic through powerful analytics without compromising privacy or control over user data. Since 2004, Matomo has been actively developed by an international team of more than 60 developers and is used on more than 1 million websites worldwide.
Pros: The main advantages of using Matomo include:
– It is free and open source meaning you have full control and ownership over your data without relying on external vendors.
– You can host Matomo on your own servers giving you full privacy and control without any third party having access to your visitor data.
– Feature rich with similar reports and analytics capabilities as Google Analytics but without the privacy concerns.
– Actively developed by an international team ensuring it has all the latest functionality.
Cons: One potential disadvantage is that since Matomo is self-hosted, you need technical expertise to install, configure and maintain the software on your own servers. This is a higher barrier for smaller websites or those without in-house developers.
Pricing: Matomo is completely free to download and use without any limits. There are no paid plans or additional licensing costs. The only costs would be your own server hosting and maintenance if you choose to self-host Matomo on your infrastructure.
Some key stats about Matomo include:
– More than 60 developers actively contribute code to the project.
– Used on over 1 million websites worldwide.
– Has similar data tracking and analytics capabilities as Google Analytics but is entirely self-hosted on your own servers.
– Available in over 30 languages with translations being community contributed.
6. Mixpanel
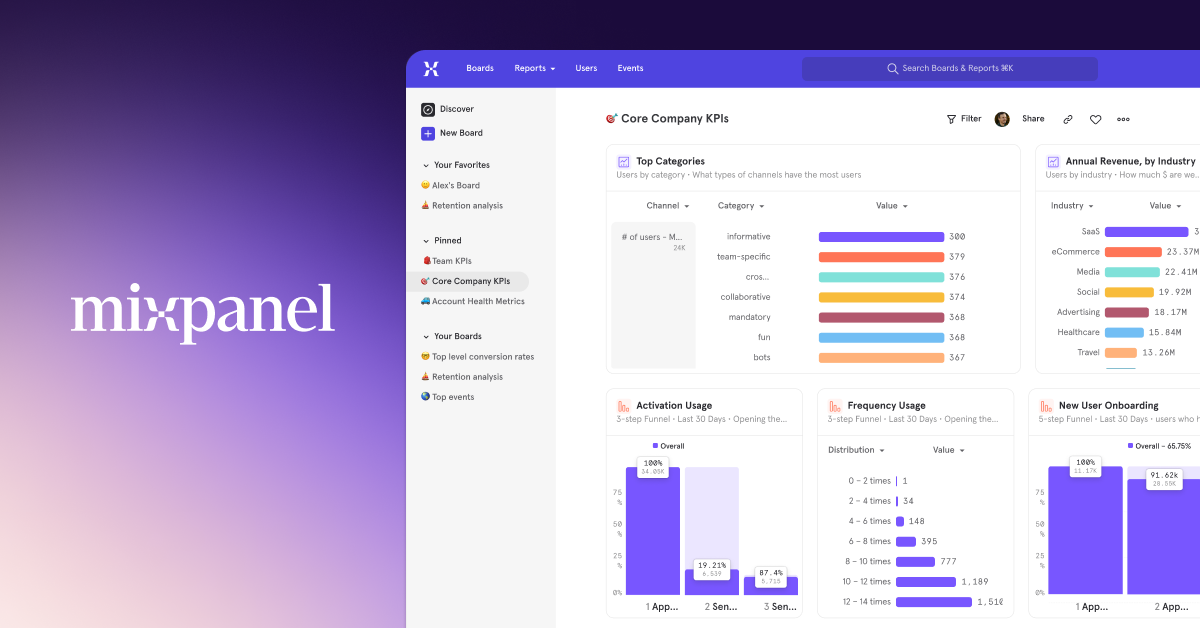
Mixpanel is an analytics platform that helps companies analyze user behavior and measure the impact of their products. Founded in 2009 and based in San Francisco, it allows companies to track user events, analyze behavior segmentation and cohorts, and identify opportunities for improvement. With over 28,000 customers in over 130 countries, Mixpanel aims to make complex event data accessible to everyone.
Pros: Some key advantages of Mixpanel include:
– Powerful segmentation and cohorts analysis to group and compare user behaviors
– Real-time event streaming and funnel analytics to optimize conversion journeys
– Data export and API integrations to connect Mixpanel data to other tools and platforms
Cons: One potential disadvantage of Mixpanel is that the free tier has limited functionality and data retention compared to paid plans. Customers may need to upgrade for advanced features or to retain more than 14 days of historical data.
Pricing: Mixpanel offers three pricing tiers:
– Free: Limited to 10,000 events/month, 14 days of retention.
– Growth: $999/month, 50 million events/month, 30 days of retention.
– Scale: Custom pricing, unlimited events and retention.
Some key stats about Mixpanel include:
– Tracks over 1 trillion events per month from sites, apps, and devices.
– Serves over 28,000 organizations worldwide across industries like gaming, ecommerce, and technology.
– Has raised over $180 million in funding from top investors like Y Combinator, Benchmark, and Index Ventures.
– Integrates with over 85 different tools including Google Analytics, Amplitude, and Heap to provide a unified view of customer data.
7. Splunk
Splunk is a data analysis platform that helps organizations collect, monitor and analyze data from various IT and business systems. Founded in 2003, Splunk’s software allows users to search, monitor and analyze machine-generated big data via a web-based interface. With over 15,000 customers worldwide, Splunk has become a leader in the analytics space.
Pros: Some key advantages of Splunk include:
– Versatile for IT operations and security monitoring
– Robust analytics for structured and unstructured data
– Cloud, on-premise, and hybrid deployment options
– Powerful search capabilities for log data and metrics
Cons: One potential disadvantage is the cost – Splunk Enterprise licenses can be expensive for very large deployments handling petabytes of data on an ongoing basis.
Pricing: Splunk offers various pricing options including on-premise licenses priced per index capacity as well as cloud deployment options priced based on data volume with usage-based overages. For small evaluators and proof of concepts, Splunk also offers free trials and developer licenses.
Some key stats about Splunk include:
– Over 15,000 customers globally including 95% of Fortune 500 companies
– Supports over 50 different data formats for ingestion
– Can index over 500TB of data per day
– Publicly traded on NASDAQ with a market cap over $20 billion
8. Flourish
Flourish is an analytics and data visualization platform that helps users tell stories with data. The platform provides over 200 different chart types to visualize data as well as features to assist with effective storytelling. Founded in 2012, Flourish aims to make data visualization accessible to everyone.
Pros: Key advantages of Flourish include:
– Wide range of chart types to effectively visualize different data sets
– Features like guides and templates to assist non-experts with storytelling
– Embeddable interactive visualizations that can be shared externally
– Supported integrations with major data sources
Cons: A potential disadvantage is that the free plan only supports limited storage and embedding which could be an issue for larger data sets or commercial uses.
Pricing: Flourish offers the following pricing plans:
– Free – Limited storage and embedding, good for personal use
– Professional – $49/month – No storage limits, unlimited embedding and exports
– Business – Custom pricing – Dedicated support, private link sharing and branding
Some key stats about Flourish include:
– Over 200 different chart types to visualize data
– Features to assist with storytelling like templates, guides and embedding
– Supports major data sources like Google Sheets, CSV files and APIs
– Free tier option available
9. Qlik
Qlik is a leader in data analytics and BI software. Founded in 1993, Qlik’s flagship product is Qlik Sense, a business intelligence and visual analytics platform helping organizations make better decisions by exploring all their data. In addition to analytics, Qlik offers data integration and data quality solutions through its acquisition of Talend in 2021.
Pros: Some of the main advantages of Qlik include: Its associative data model allows for exploration of related data across any number of dimensions.Embedded analytics capabilities allow visualizations and insights to be embedded across desktop, web, and mobile applications. Its governance capabilities through Qlik Sense Enterprise help secure and manage data access across the organization.
Cons: One potential disadvantage is that Qlik Sense requires more technical skills and data modeling compared to simpler drag-and-drop BI tools. Advanced capabilities may be overkill for some smaller organizations.
Pricing: Qlik Sense pricing varies depending on specific needs but generally starts at $3500/user annually for the standard license. Additional costs apply for enterprise features like central management, governance, and cloud deployment. On-premises deployment requires additional hardware costs.
Some key stats about Qlik include:used by over 38,000 customers globally including major corporations like Amazon, Netflix, and McDonalds.Qlik Sense was named a leader in the 2021 Gartner Magic Quadrant for Analytics and Business Intelligence Platforms.Qlik has over 3,000 employees worldwide with headquarters in Pennsylvania, USA.
10. Segment
Segment is a customer data platform (CDP) that helps companies collect, clean, and control customer data. Founded in 2011 and based in San Francisco, Segment has raised over $180 million from investors including Sequoia, Index Ventures, and Coatue.
Pros: Some key advantages of Segment include:
– Central platform for collecting customer data from any source
– Real-time routing and transformation capabilities to cleanse and activate customer data
– Seamless integration with over 250 marketing, analytics and CRM tools
Cons: The main disadvantage is the pricing, as the platform is costly for larger businesses with high data volumes.
Pricing: Segment offers three pricing tiers:
– Starter: Free for up to 100k events/month and 3 users
– Professional: $999/month for up to 500 million events/month and 10 users
– Enterprise: Custom pricing for >500 million events/month and dedicated support
Some key stats about Segment include:
– Ranked #1 Customer Data Platform four years in a row per IDC reports from 2019 to 2022
– Supports over 250 integrations including Google Analytics, Adobe, and others
– Used by over 50,000 companies including IBM, Atlassian, and Shopify
– Processes over 500 billion events per month from connected apps and sites
11. Domo
Domo is an all-in-one analytics platform that provides businesses with data management, visualization, and governance capabilities. Founded in 2010, Domo’s cloud-native platform gives organizations a single source of truth for data and insights across all business functions.
Pros: Key advantages of the Domo platform include: It offers an all-in-one solution for data integration, preparation, visualization and governance without requiring separate tools. Embedded analytics capabilities via APIs allow for delivering insights anywhere via mobile or custom applications. Governed dashboards ensure consistency and appropriate access of data and analytics across the entire organization.
Cons: A potential disadvantage is the higher cost compared to some other point solutions for certain use cases. Domo’s all-in-one platform requires more investment compared to best-of-breed tools focused on specific analytics tasks.
Pricing: Domo’s pricing starts at $1500/month for 10 users and scales based on the number of users. Additional costs occur for premium services like data management, alerting and governance packs. Domo also offers flexible enterprise agreements for large deployments.
Some key stats about Domo include: Used by over 3,000 customers worldwide across all industries, Secures billions of records from terabytes of data, Has over 350 prebuilt connectors for popular data sources, Processes over 3.5 trillion rows of data per month.
12. LogRocket
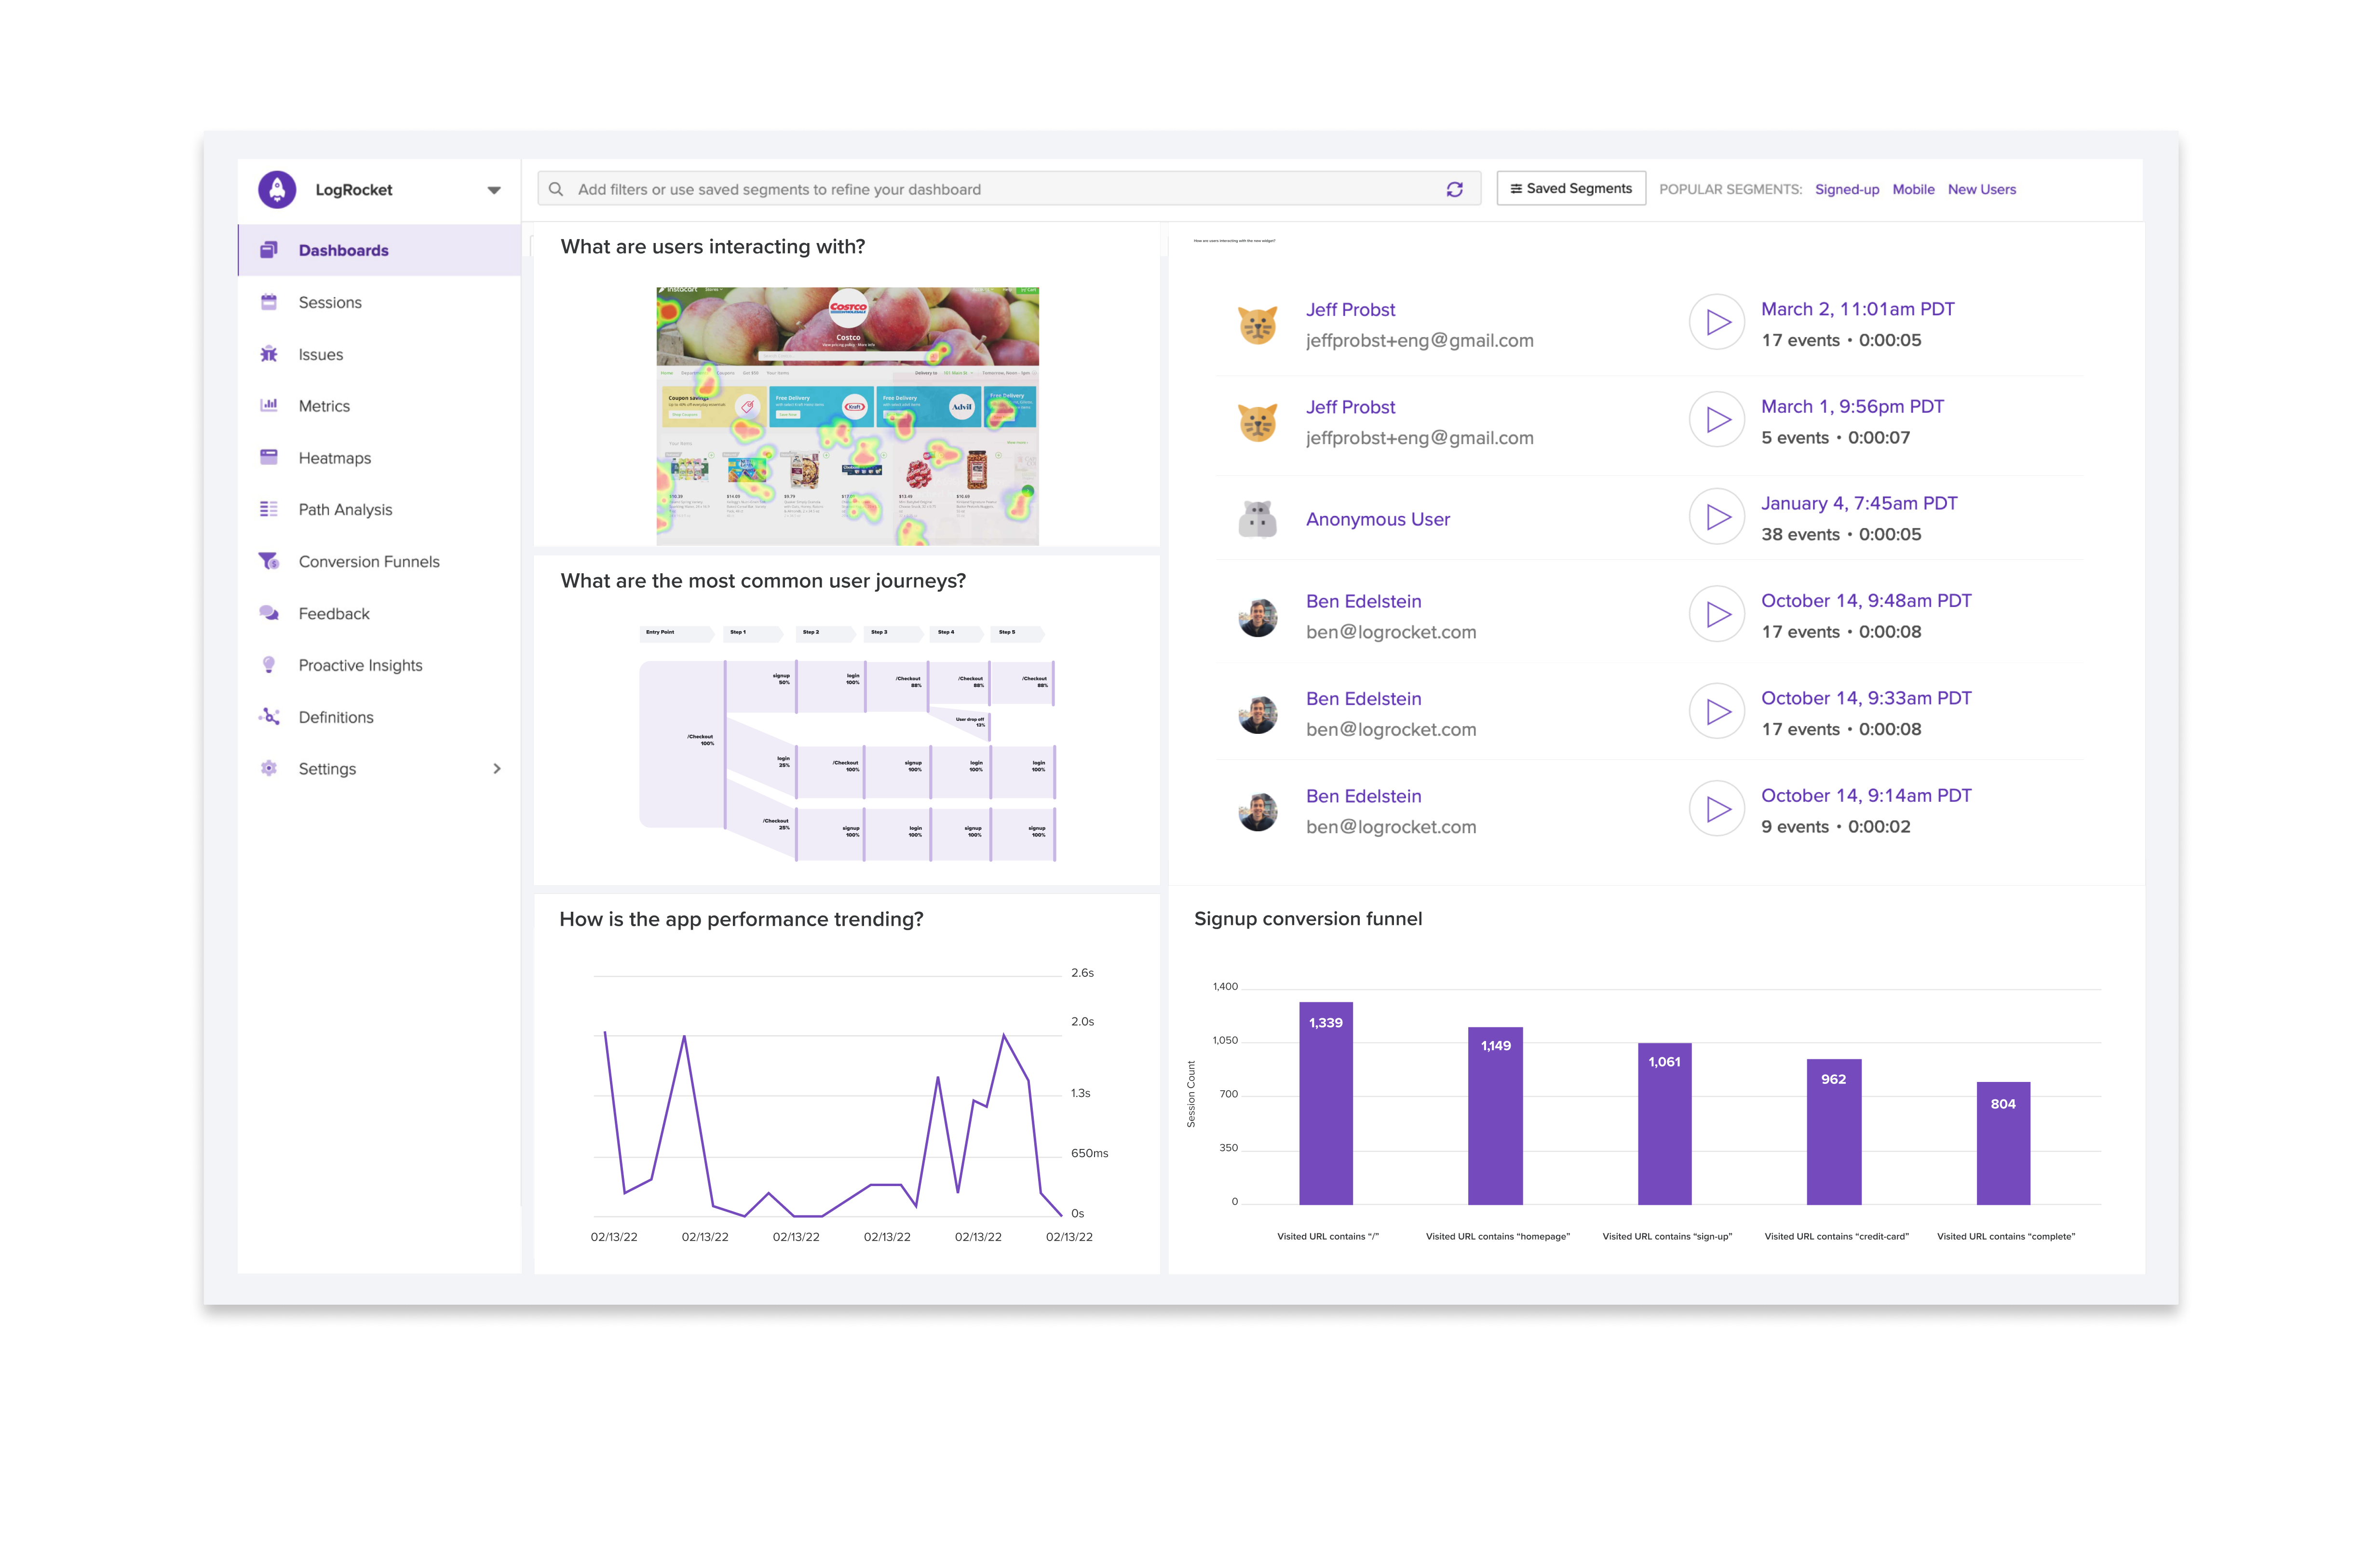
LogRocket is an analytics platform that helps engineering teams understand user experiences and identify issues affecting their users. With LogRocket, organizations can replay and debug sessions to diagnose issues, monitor frontend performance, and optimize apps.
Pros: Some key advantages of LogRocket include:
– UX session replay allows teams to replay entire user sessions after the fact to understand and diagnose issues.
– Error monitoring and debugging helps isolate and resolve errors affecting users.
– Front-end performance monitoring identifies bottlenecks to optimize load times and improve user experience.
Cons: One potential disadvantage is that LogRocket does require integrating client-side JavaScript which could introduce errors or performance hits to sites or apps using it.
Pricing: LogRocket offers various pricing plans starting from a Free plan up to an Enterprise plan. Pricing is based on the number of monthly active users. The Free plan supports up to 10,000 MAU. Contact sales for pricing on higher volume plans.
Some key stats about LogRocket include:
– Over 20,000 organizations use LogRocket including companies like Anthropic, Tandem, and Vidyard.
– LogRocket records and replays entire user sessions including images, clicks, taps, scrolls and more.
– Logs over 500 million events per month to help teams understand user behavior.
13. Amplitude
Amplitude is a leading product analytics solution that helps companies build better products and strengthen customer relationships through continuous optimization. Founded in 2012 and based in San Francisco, Amplitude’s platform collects user behavior data from digital products and turns it into actionable insights.
Pros: Some key advantages of Amplitude include:
– Strong product analytics capabilities for both mobile and web apps
– Custom event tracking that lets you define any user behaviors or actions to analyze
– Behavioral analytics and segmentation tools to understand user habits and behaviors
– Actionable insights and dashboards to diagnose product issues and improve conversions
Cons: One potential disadvantage is that the platform may have a somewhat steeper learning curve compared to other analytics solutions due to its advanced capabilities.
Pricing: Amplitude offers different pricing plans depending on usage needs. Basic plans start from $799/month while enterprise plans with additional features are customizable based on data volume and requirements.
Some key stats about Amplitude include:
– Over 40,000 digital products use Amplitude to better understand user behavior
– Customers include prominent brands like NBCUniversal, Mozilla, Atlassian and Pandora
– Integrates with various platforms and tools including Google Analytics, Facebook Analytics and Mixpanel
– Supports event tracking and analytics for both mobile and web apps
14. Sisense
Sisense is a business intelligence and analytics platform that helps organizations turn their data into insights. Founded in 2004, Sisense aims to make advanced analytics accessible for all users with an embeddable, self-service platform. The platform supports over 1000 different data sources and allows users to build interactive dashboards and reports with robust visualization capabilities.
Pros: Some of the main advantages of the Sisense analytics platform include:
– Self-serve business intelligence that empowers all users, not just analysts or developers
– Easy to use interface for creating customizable dashboards and reports visually with drag-and-drop
– Robust data modeling and ETL capabilities for exploring and preparing data
– Support for building predictive models directly into apps without coding
– Secure, cloud-based platform that scales from small to very large data volumes and users
Cons: One potential disadvantage is that advanced customizations may require some coding knowledge of JavaScript or SQL. While the goal is to make analytics accessible for all, more complex integrations could rely on developer involvement.
Pricing: Sisense offers a variety of pricing plans including free and open-source options as well as monthly and annual pricing for its commercial products. Pricing is typically based on the number of users, data volume, and required support levels.
Some key stats and capabilities of the Sisense platform include:
– Supports over 1000 different data sources out of the box including databases, data warehouses, Cloud data lakes, APIs and more
– Supports building predictive models and AI directly into apps with no code required
– Dashboards and reports can be embedded into any website, app or CRM system
– Scales from small teams to the largest enterprises with billions of rows of data
15. Looker
Looker is an enterprise-grade business intelligence and analytics platform that allows companies to explore, visualize and share data-driven insights.
Pros: Some key advantages of Looker include:
– Embedded analytics for app and website developers to integrate insights directly into products
– Flexible data modeling and robust access controls to handle complex data environments
– Intuitive dashboard creation and powerful ways to share and distribute dashboards to large audiences
Cons: One potential disadvantage is that the platform is more suited for larger enterprises with substantial BI needs and budget compared to smaller companies due to its enterprise-grade features and pricing.
Pricing: Looker pricing starts at $150 per user per month for the Standard plan and scales based on additional features, volumes and support required. There is also an option to deploy Looker on Google Cloud Platform with usage-based pricing.
Some key stats about Looker include:
– Over 2500 customers globally including Starbucks, GoDaddy, and Nielsen
– Embedded analytics available through over 50 integrations including Salesforce, Hubspot, and Marketo
– Integrates with all major data sources including SQL, Google BigQuery, Snowflake, AWS etc.
Conclusion
Based on our comprehensive evaluation of features, reviews and market presence, the leading platforms that rose to the top include Tableau, Microsoft Power BI, Google Data Studio, Looker, Domo and Sisense. While all 15 platforms reviewed here are strong options, these six stood out as having the most well-rounded and innovative capabilities. They provide powerful functionality for business users and developers alike, with exceptional usability, support for various data sources and large customer bases. For organizations seeking an enterprise-grade BI tool, any of these platforms would be an excellent choice.


