Introduction
As applications have become central to business operations, ensuring high performance and availability has never been more important. Application performance monitoring (APM) tools provide invaluable insights into application and infrastructure health to help pinpoint issues quickly. With so many options on the market, choosing the right APM tool can be overwhelming. This guide analyzes 15 leading tools against important criteria to help you make an informed choice.
Methods of Evaluation
Each APM tool will be evaluated based on the following criteria: features and functionality, pricing and scalability, ease of setup and use, customer support, and overall market presence and reputation. Market presence will take into account metrics like third-party analyst rankings, number of customers, mind share in the industry, and traits like # of backlinks, traffic and keyword trends to determine which solutions are receiving the most attention online.
1. Elastic APM
Elastic APM is an application performance monitoring tool developed by Elastic. It is designed to help users monitor and troubleshoot application performance issues by providing real-user monitoring, distributed tracing, and log data analytics.
Pros: Some key advantages of Elastic APM include: It is from the same company as the popular Elasticsearch and Kibana tools, allowing seamless integration with the ELK stack. It enables distributed tracing to trace requests across distributed systems. It offers out of the box Kibana dashboards to visualize performance data and troubleshoot issues. As an open source tool, it offers great flexibility and customizability.
Cons: One potential disadvantage is that as a free and open source tool, it may not offer the same level of commercial support and services that paid proprietary APM tools provide.
Pricing: Elastic APM offers a free open source tier suitable for development and testing. It also has paid tiers starting from $5/host per month for the bronze plan up to enterprise plans for large organizations.
Some key stats about Elastic APM include: It is used by over 30,000 companies globally. It supports over 50 programming languages and frameworks out of the box. It is fully open source and offers a free tier for beginners.
2. Micro Focus
Micro Focus is an enterprise software company focused on enterprise DevOps, observability and security solutions. One of their flagship products is Micro Focus Operations Manager, a long-established application performance monitoring (APM) solution for monitoring applications, infrastructure and business services across physical, virtual and cloud environments. Operations Manager provides deep visibility into applications, allowing teams to proactively resolve issues.
Pros: Some key advantages of Micro Focus Operations Manager include:
– Broad platform and technology coverage that supports modern heterogeneous environments.
– Strong out-of-the-box monitoring capabilities reducing time to value.
– Ability to unify monitoring across physical, virtual and cloud environments from a single console.
– Mature and customizable user experience with roles-based access controls.
Cons: One potential disadvantage is that as an established vendor, the interface may feel dated compared to some newer purpose-built APM tools. The learning curve is also steeper compared to more intuitively designed products.
Pricing: Pricing for Micro Focus Operations Manager is based on the number of monitored nodes/devices. It is available in on-premises perpetual licenses as well as cloud-based subscriptions. Contact Micro Focus or an authorized reseller for an exact quote tailored to your specific requirements and environment.
Some key stats about Micro Focus Operations Manager include:
– Over 30 years of development history and deployments at over 20,000 customer sites worldwide.
– Supports monitoring of over 350 technologies including Java, .NET, C/C++, databases, web servers, and middleware.
– Integrations with over 50 ecosystem partners like Splunk, Datadog, AWS and more.
– Supports hybrid monitoring with on-premises and SaaS deployment options.
3. Veeam ONE
Veeam ONE is a powerful application performance monitoring tool from Veeam, the #1 market leader in data backup solutions. Veeam ONE provides comprehensive monitoring of Virtualization, backups, storage and cloud environments to help ensure optimal performance.
Pros: Some key advantages of Veeam ONE include:
– Agentless monitoring for quick deployment
– VM backup monitoring and reporting
– Backup and replication monitoring and alerts
– Comprehensive service level reporting
– Capacity management for optimal storage utilization
Cons: One potential disadvantage is that the full feature set requires a paid subscription versus some free open source alternatives.
Pricing: Veeam ONE is available in various subscription tiers starting from $95 per VM for the basic standard edition up to $145 per VM for the premium edition.
Some key stats about Veeam ONE include:
– Monitors over 50,000 configurations across private, public and hybrid clouds
– Protects over 1 million workloads
– Used by over 350,000 customers globally
– Supports VMware vSphere, Microsoft Hyper-V, Nutanix AHV and more platform
4. Splunk
Splunk is an application performance monitoring (APM) and infrastructure monitoring tool used by many large enterprises worldwide. Founded in 2003, Splunk helps companies collect and analyze machine data for security, operations and business analytics. The company is headquartered in San Francisco and offers both on-premise and SaaS-based solutions.
Pros: Some key advantages of Splunk include:
– Extremely powerful platform for analytics and search across machine data
– Can ingest and analyze enormous volumes of data from disparate sources in real-time
– Scales elastically to support very large infrastructures with millions of devices
Cons: One potential disadvantage is the high total cost of ownership for very large deployments due to licensing costs which are based on data volume indexes. However, Splunk does offer flexible pricing and the SaaS offering mitigates these costs to an extent.
Pricing: Splunk offers flexible perpetual and subscription licensing. Pricing is based on the amount of machine data indexed per day. It also offers tiered pricing plans for its SaaS offering starting from $300/month.
Some key stats about Splunk include:
– Used by more than 92,000 customers globally including 95% of Fortune 500 companies
– Can ingest and index up to 500TB of data per day
– Has over 1,500 Add-Ons in its marketplace to extend core functionality
5. Grafana
Grafana is an open source analytics and monitoring solution developed by Grafana Labs. It offers visualizations, dashboards, and intuitive UI for graphs, charts, alerts, and more. Grafana allows users to query data from multiple sources and compose them into meaningful visualizations and dashboards.
Pros: Some key advantages of Grafana include:
– Open source leading visualization platform
– Intuitive dashboard building interface
– Tight integration with Prometheus and other leading observability tools
– Support for multiple data sources in a single dashboard
– Large ecosystem of plugins and panels
– Easy embedding of dashboards
Cons: One potential disadvantage is that as an open source tool, it lacks some enterprise features like SSO and advanced user management found in paid commercial solutions.
Pricing: Grafana offers both open source and commercial licensing options. The open source version is free to use under an Apache 2.0 license. Grafana Labs also offers paidGrafana Enterprise subscriptions with additional features starting at $50 per user per year.
Some key stats about Grafana include:
– Used by over 1,000,000 teams globally
– 30,000+ organizations rely on Grafana for observability
– Supported data sources include Prometheus, Graphite, Elasticsearch and many more
– Community of over 150,000 members in Grafana forums
6. New Relic
New Relic is an application performance monitoring tool that provides observability across your entire technology stack. Founded in 2008, New Relic helps engineers monitor their applications and infrastructure to ensure great digital experiences for their customers. With New Relic, you can gain insight into your applications’ performance, usage, and reliability to quickly identify and resolve issues.
Pros: Some key advantages of New Relic include:
– Complete APM solution that monitors services, databases, server metrics and more from a single interface
– Strong focus on developer and engineering productivity with features like error tracking and synthetic monitoring
– Great UI and visualization capabilities to analyze performance issues
– Reliable and comprehensive monitoring with no limits on data collection
– Pricing scales with usage so you only pay for what you need
Cons: One potential disadvantage is that the free tier only allows basic functionality and monitoring of one application. For more advanced features, you need to upgrade to a paid plan.
Pricing: New Relic has the following pricing plans:
– Free plan – Basic functionality for one application
– Standard plan – Starts at $50/month based on the number of hosts/hosts
– Pro plan – Starts at $100/month for additional features like custom dashboards
Some key stats about New Relic include:
– Monitors over 90,000 customers worldwide
– Processes over 5 trillion events per week
– Supported programming languages include Java, JavaScript, Go, Python, Ruby, PHP, .NET and more
– Integrates with over 250 third-party technologies like AWS, Docker, Kubernetes, etc.
7. CA Technologies
CA Technologies is a leading application performance monitoring (APM) solution for infrastructure and application monitoring. Founded in 1976 under the name Computer Associates, CA Technologies helps companies monitor the performance of business applications and supporting infrastructure.
Pros: Some key advantages of the CA Technologies APM solution include:
– Application delivery observability with end-to-end transaction tracing
– Infrastructure and cloud monitoring of servers, containers, networks and more
– Deep transaction tracing to pinpoint bottlenecks
– Customizable dashboards and analytics for performance data
Cons: One potential disadvantage is that the CA Technologies APM solution is more aimed towards larger enterprises due to its advanced capabilities and likely higher pricing compared to other options.
Pricing: CA Technologies APM offers perpetual and subscription licensing models. Pricing varies based on the number of monitored servers, transactions per day and support needs. Contact their sales team for a customized quote.
Some key stats about CA Technologies APM solution:
– Monitors over 25,000 global enterprises
– Supports over 150 technologies including Java, .NET, Node.js, Python and more
– Processes over 10 trillion events per day from customer environments
8. Uptime Robot
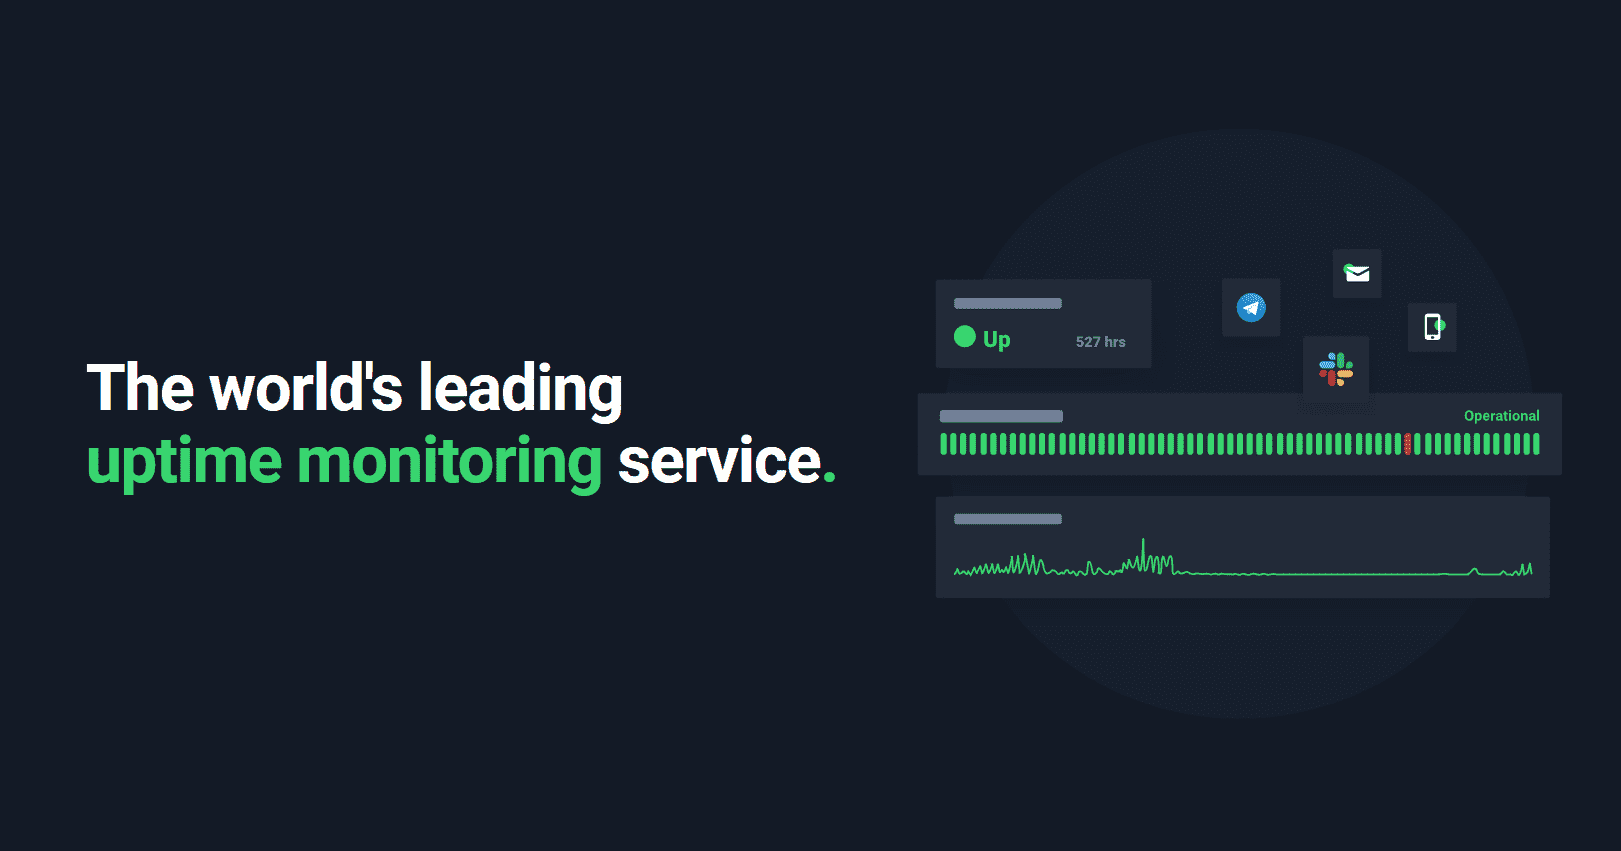
Uptime Robot is an application performance monitoring tool that allows users to monitor the availability and response time of websites and applications. Founded in 2011 and headquartered in Estonia, Uptime Robot is one of the original and most popular website monitoring services available today with over 100,000 active users.
Pros: Some key advantages of Uptime Robot include:
– Affordable and simple monitoring solution
– Great for basic website/app monitoring
– Powerful free tier for small deployments
– Real-time alerts by email, SMS, Slack, webhook etc.
– Very easy to setup and doesn’t require code changes
Cons: The main disadvantage of Uptime Robot is that it is more tailored towards basic monitoring needs. More advanced features found in enterprise-grade APM solutions like application-level performance monitoring, custom dashboards, code-level monitoring are not available.
Pricing: Uptime Robot offers the following pricing plans:
– Free Plan: Up to 50 monitors for free
– Startup Plan: $9/month for up to 500 monitors
– Professional Plan: $29/month for up to 10,000 monitors
– Enterprise Plan: Custom pricing for large scale deployments
Some key stats about Uptime Robot include:
– Monitors over 500,000 websites and servers
– Offers monitoring in over 100 countries worldwide
– Supports unlimited websites on its paid plans
– Has over 100,000 active users
9. Tenable.io
Tenable.io is a vulnerability management and application performance monitoring solution developed by Tenable, Inc. As one of the largest cyber exposure management companies, Tenable helps organizations understand and reduce cybersecurity risks.
Pros: Some key advantages of Tenable.io include:
– Comprehensive vulnerability management platform
– Powerful scanning, detection and monitoring capabilities
– Strong continuous monitoring integrations with external systems
– Prioritization of vulnerabilities to streamline remediation efforts
Cons: One potential disadvantage is that Tenable.io is geared more towards large enterprises compared to small businesses due to its scalability and pricing. The learning curve may also be steeper for some users accustomed to simpler solutions.
Pricing: Tenable.io pricing starts at $4,000 per year for 25 assets under management with additional costs depending on number of assets managed. Volume-based discounts are available for large deployments covering thousands of assets.
Some key stats about Tenable.io include:
– Protects over 30,000 organizations globally
– Scans for vulnerabilities across IT, cloud, containers and IoT environments
– Performs continuous monitoring of over 1 billion assets
– Integrates with over 150 security and IT tools for comprehensive visibility
10. Datadog
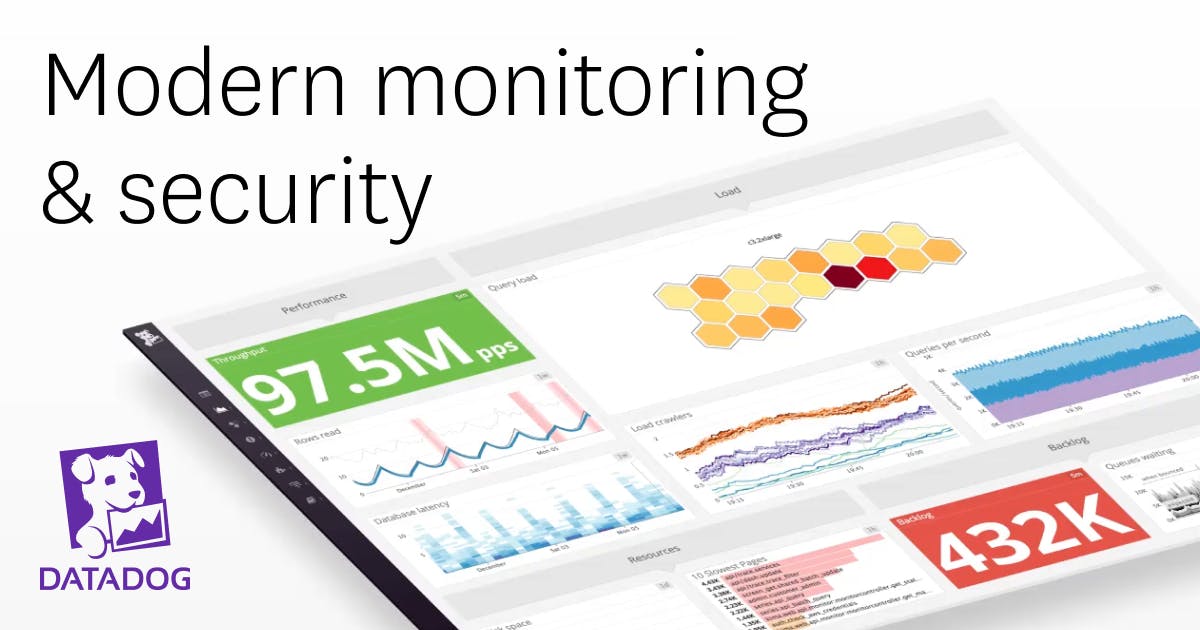
Datadog is a cloud-based monitoring platform that helps development and operations teams see inside any stack, any app, at any scale, anywhere. Founded in 2010 and based in New York City, Datadog is the leader in APM and infrastructure monitoring space.
Pros: Key advantages of Datadog include:
– Easy to deploy agentless and agent-based monitoring of servers, containers, services and applications.
– Provides extensive out-of-the-box integrations and metrics collection with almost every major technology.
– Intuitive dashboards and alerts for real-time visibility into infrastructure and applications performance.
– Powerful alerting capabilities with notifications across email, PagerDuty, Webhooks and other channels.
Cons: One potential disadvantage is that the free tier limits are quite low which may require upgrading plans for medium to large scale applications and infrastructure deployments.
Pricing: Datadog offers flexible pricing plans based on usage with the following general tiers:
– Free – Up to 500 metrics and several integrations. Good for testing and small deployments.
– Starter – $29/month – Unlimited metrics and integrations. Suitable for smaller teams and non-critical workloads.
– Pro – $99/month – Advanced features like process monitoring. Most popular plan.
– Enterprise – Custom quote – Dedicated support for mission critical environments.
Some key stats about Datadog include:
– Used by over 15,000 organizations globally including Fortune 500 companies like Lyft, IBM, and JPMC.
– Collects over 1 trillion metrics daily from clusters, services, and applications across cloud infrastructures and data centers.
– Supported integrations with over 500 technologies including AWS, Azure, Google Cloud, Kubernetes, Docker, Azure, and more.
11. Dynatrace
Dynatrace is an enterprise software company providing cloud observability, application performance management, and digital experience monitoring for hybrid and multi-cloud environments. Founded in 2005, Dynatrace operations monitoring software uses artificial intelligence for automatic discovery, real-user monitoring, and application security.
Pros: Some key advantages of Dynatrace include:
– Leader in AI powered APM with automatic topology mapping and anomaly detection
– Automatic instrumentation of applications means less setup and maintenance
– Advanced causal mapping and root cause analysis using AI/ML pinpoints issues rapidly
– Continuous integration and deployment support for cloud-native environments
– Scalable SaaS pricing with no software or hardware to manage
Cons: One potential disadvantage is that Dynatrace is an enterprise-level product which can be costly for smaller development teams on a budget. However, it offers a free trial and scaled pricing plans.
Pricing: Dynatrace offers flexible pricing plans including free trials and perpetual licenses. Main plans include Team, Team Plus, Enterprise, and Optimized. Pricing starts at $1,500-$6,500 per month based on volumes monitored for SaaS plans. Perpetual licenses with on-prem software also available.
Some key stats about Dynatrace include:
– Monitors over 1 trillion transactions daily for customers
– Supports over 25 platforms including AWS, Azure, GCP, Kubernetes
– Instrumented monitoring for over 750 technologies including Java, .NET, Node.js, Python
– Named a Leader in the 2023 Gartner Magic Quadrant for APM for its completeness of vision and ability to execute
12. Prometheus
Prometheus is an open-source systems and service monitoring system. It collects metrics from configured targets at given intervals, evaluates rule expressions, displays and stores the results. Some key features of Prometheus include its open-source and free nature, time series database, metrics collection viaPush/pull, simple yet powerful PromQL query language and large community support.
Pros: Some key advantages of Prometheus include:
– Open-source and free to use with no vendor lock-in
– Pull/Push based instrumentation allows flexibility in metrics collection
– Time series database allows for fast, efficient storage and queries of metrics over time
– PromQL query language is simple yet powerful for analyzing metric queries
– Large, active community for help, plugins and support
Cons: One potential downside of Prometheus is that it requires some configuration and custom exporters to get up and running compared to other plug-and-play APM solutions.
Pricing: Prometheus is open-source and free to download and use. There is no paid support or pricing. Companies like CoreOS do offer commercial support and services for Prometheus.
Some key stats about Prometheus include:
– Used by companies like CoreOS, Google, and Weaveworks
– Over 20K GitHub stars
– Supports over 30 native exporters and hundreds of third-party exporters
– Simple yet flexible data model based on time series
13. Zabbix
Zabbix is an open source application performance monitoring (APM) tool. It is a mature and effortless enterprise-class open source monitoring solution for network monitoring and application monitoring of millions of metrics. Zabbix offers comprehensive infrastructure monitoring, is extensible through plugins, and is highly scalable even for large environments.
Pros: The key advantages of Zabbix include: Comprehensive infrastructure monitoring for servers, networking, storage and cloud environments. Offers out of the box monitoring of common services and the ability to easily create custom checks. Highly scalable architecture that can monitor very large heterogeneous IT environments. Plugins allow extending baseline monitoring capabilities. Free open source software with no vendor lock-in.
Cons: One potential disadvantage of Zabbix is that it has a more involved installation and setup process compared to some proprietary APM tools. It requires more technical expertise and resources to initially configure and customize compared to out of the box solutions.
Pricing: Zabbix is open source software that can be downloaded and used at no cost. There are also paid support options available directly through Zabbix LLC and via third party resellers and consultants for enterprises that need assistance with customization, large scale deployments or 24/7 support.
Some key stats about Zabbix include: Monitors over 500 enterprise systems, servers, switches, applications and services. Handles tens of millions of metrics per day. Scales to monitor very large environments with thousands of systems. Actively maintained by a worldwide open source community with over 25,000 individual contributors.
14. Redgate SQL Monitor
Redgate SQL Monitor is an application performance monitoring (APM) tool from Redgate Software that helps developers and DBAs monitor SQL Server performance. SQL Monitor provides real-time monitoring of SQL queries, alerts on slow queries or locking issues, and historical reports on database usage.
Pros: Some key advantages of Redgate SQL Monitor include:
– Easy to install agentless collection of SQL monitoring data.
– Intuitive graphical user interface for viewing query performance and historical trends.
– Out-of-the-box reports on database usage, top queries, blocking sessions.
– Advanced capabilities like query tuning recommendations and blocking chain exploration.
Cons: A potential disadvantage is that SQL Monitor is a commercial tool that requires an annual subscription license to use long-term.
Pricing: Pricing for Redgate SQL Monitor starts at $1,995 per year for a 25 server license. Additional server licenses are $129 each. The tool also offers free 30-day trials to evaluate the product before purchasing.
Some key stats and capabilities of Redgate SQL Monitor include:
– Monitors SQL performance on live databases across on-premises, Azure SQL Database, and Amazon RDS instances.
– Alerts on long-running queries, blocking/deadlocks, high CPU or waits.
– Tracks database schema changes and deployed migrations.
– Provides detailed diagnostics on stored procedure and query performance.
15. ManageEngine OpManager
ManageEngine OpManager is an on-premises and SaaS-based application performance monitoring tool developed by ManageEngine. It helps IT administrators and DevOps teams monitor the performance of business-critical applications across distributed IT environments.
Pros: Some key advantages of ManageEngine OpManager include:
– Multi-vendor network monitoring capabilities to monitor routers, switches and other network devices
– Comprehensive application performance monitoring for web apps, databases, servers, etc.
– Flexible user management and permission controls for large IT teams
– Powerful notification engine to configure alerts via email, SMS, push notifications and ITSM ticketing
Cons: One potential disadvantage is that as an on-premises product, it requires hardware procurement and ongoing maintenance of the monitoring servers. However, it also offers a cloud-hosted SaaS option to avoid on-prem infrastructure costs.
Pricing: Pricing starts from $1,995 per year for the basic edition covering up to 100 systems. Enterprise editions with additional capabilities are also available starting at $3,495 per year. Discounts are available based on the number of systems monitored and contract term. Both perpetual and subscription licensing is available.
Some key stats about ManageEngine OpManager include:
– Monitors over 500 applications and technologies out of the box
– Supports over 150 monitoring templates for popular apps like SAP, Oracle, Microsoft, etc.
– Supports monitoring of over 15,000 metrics
– Integrates with over 50 third-party tools through APIs and plugins
– Monitors over 100,000 systems for many large enterprise customers
Conclusion
With a growing number of powerful and affordable options, finding the right APM solution to fit your specific monitoring needs is very achievable. Use this guide to evaluate tools against your key criteria to shortlist the top choices. Then be sure to test prominent options yourself to see which interface and features provide the most value. With the right tool, you’ll have continuous insight to deliver great digital experiences and quickly resolve issues to keep applications running optimally.


